Reply With Quote
I say bull to this. Please support this contention.
Your link only supports what everyone knows about increased humidity. It does not support your 1:1.

Bull .
It's because you are lying. the claim is invalid.
You aren't man enough to say you made a mistake.
I read the file again, didn't see it anywhere, besides.... they are talking about modeling vs. observation.
I say bull to this. Please support this contention.
Your link only supports what everyone knows about increased humidity. It does not support your 1:1.

Maybe if you read it a 3rd time you'll magically understand it. Give it a try.
If anything, the 1:1 ratio I posted is conservative.
That's OK.
I understand.
You are too childish to give a strait answer. You must play games.
Let me know when you are willing to show you actually comprehend this stuff. Right now, it looks like you only pretend to.
If you say so.
Don't be sad WC.I'm sure some of the other boys and girls want to play with you.
Yes, I'm sad. I'm sad that I am wasting my time with your childish at ude.
I'm sad that you don't understand the science enough to show us why I'm wrong, if I am.
I'm sad for you that I believe your money for your education will be wasted. Really now, if you can't explain such simple questions, how will you get a job?
are you going to be interviewing me? If so I'm ed!
Manny...
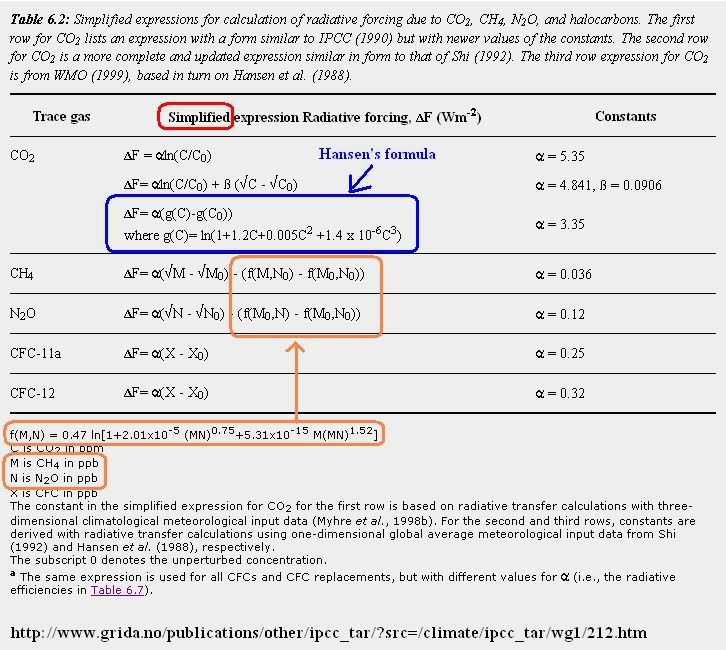
For a total 2 C increase, H2O would increase by 13.2% average. If CO2 is 1 C of this increase, and H2O is the other 1 C, then H2O would have to be much stronger than the AGW community gives it credit for. It would have to be so much stronger, that CO2 is almost meaningless.
Do the math. See for yourself. Plot a 13.2% increase vs. a 1 C rise on a logarithmic curve. I used Hansen's formula for CO2.

I spent off and on for a week trying to get him to understand how to look at functions as phenomenon modeled through time. How to look at them as multiple variables that are mathematically related.
How scientists use these methods to explain phenomenon and you just cannot take the difference of two completely arbitrary points in time and multiply them by a K value off of a chart and think its predictive of anything.
You have seen the derivatives that they model the oceans with.
He is stuck on the level of
x/225 = .776 therefor
x = 174
If you look at his napkin math they all boil down to this type of thing. This is stuff they already expect you to know in remedial math courses in college and that's his limit.
Not being to explain things to someone who is that simple minded is not reflective of anything other than he being dumb as .
Hey WC, when you take a partial derivative of x of a function of x and y. You treat the variable y as a constant when you do the differentiation BUT is it still a constant AFTER the operation is done?
Right on cue with the stupid!
DERP!!!!
And what you fail to understnd is that no matter how you look at the other variables, and no matter what you do with the partial derivatives, the variable for the changes in temperature and salinity is a linear multiplier to the rest.
None of the rest matters when you want to see only the changes of temperature.
Looks like Manny put up the white flag.
I'm sorry that you are too stupid to follow what I did. What part do you need me to explain?
Is this what you're calling napkin math FuzzNutz?
I understand why Manny put up the white flag.
"Suggest" is such a powerful word. And when coupled with "model," it means so much!Current climate models suggest that this provides
an important positive feedback, roughly doubling
the sensitivity of the surface temperature to an
increase in anthropogenic greenhouse gases (35).

Sorry I missed something so meaningful to you Manny. It seems rather insignificant to me. You know my feelings about climate models. They are made to reflect past observations, and never properly predict the future changes.
I think once he realized the forcing math didn't work, he knew he couldn't make something up to convince anyone.
FYI, I waved the white flag with you a LONG time ago. I think most have.
Yeah, good point. Those past observations are just dead wrong. Besides, the earth is only 4500 years old.
The next step is to find the next hurricane tracking model, few days in advance in landfall and camp out on a beach middle of track just to prove your point.
If you make it ok, it's God's will. If not, he just doesn't like you. It's an unknown, just like a climate model.
On a more serious side Manny, do you know what an accepted sensitivity is for forcing to degrees? This is an aspect I haven't seen before as definite, and everything I've seen is contradictory to another.
Is there an accepted value out there?
If I use 3.7 w/m-2 for one degree, that limits the radiative downforcing to about 122 w/m-2. However, other studies have the greenhouse effect to somewhat over 320 w/m-2. This would indicate a sensitivity of around 9.7 per degree.
This is a linear function, isn't it?
Anyway, if I go with the 3.7, the constant in Hansen's formula would be 3.12. TAR has it at 3.35 which isn't a dramatic difference. I forget the changes between TAR and AR4 for CO2 forcing without looking it up, but it does yield 1.61 watts/m-2 vs. the AR4 1.66. To get 1.66, the constant is equal to 3.216. If I plot H2O on a more pure logarithmic curve than for CO2, for 13.2% more water vapor (2C response) to equal another 1 degree, I get constant value of 29.84. If I use the same formula for CO2, the constant value is 10.3. Either way, a doubling is pretty high. 5.4 degrees using Hansen's formula vs. 5.6 degrees for a more pure logarithmic formula.
Care to comment?
Last edited by Wild Cobra; 06-17-2012 at 03:59 AM.
Quoting someone elses work does not speak to your abilities. The you write down as your 'work' is arithmetic and fractions. Its kids learn by 7th grade. Even those in the dummie classes.
You do not remotely understand how things interrelate. You clearly do not understand the significance of log functions and 'linearity.' It is pretty apparent that you are just tossing out terminology and have no notion of the point of them being used in a discussion on modeling.
You should really just punch yourself in the face. You really questioned if a log is linear?
That's not even the point of linearity anyway. You are talking about summing exclusive outputs and not superimposing.
Oh and pray do tell how you get a 'more' logarithmic function than hansen's ln(1+ax+by+cz)? That just sounds like stupidspeak for "i aribtrarily just made up even more numbers."
And you still really really suck at thermodynamics.


Models, of any kind, are only as good as their predictive ability.
James Hansens climate forecast of 1988: a whopping 150% wrong
From their Die kalte Sonne website, Professor Fritz Vahrenholt and Dr. Sebastian Lüning put up this guest Post by Prof. Jan-Erik Solheim (Oslo) on Hansens 1988 forecast, and show that Hansen was and is, way off the mark. h/t to Pierre Gosselin of No Tricks Zone and WUWT reader tips.
Figure 1: Temperature forecast Hansens group from the year 1988. The various scenarios are 1.5% CO 2 increase (blue), constant increase in CO 2 emissions (green) and stagnant CO 2 emissions (red). In reality, the increase in CO 2 emissions by as much as 2.5%, which would correspond to the scenario above the blue curve. The black curve is the ultimate real-measured temperature (rolling 5-year average). Hansens model overestimates the temperature by 1.9 ° C, which is a whopping 150% wrong. Figure supplemented by Hansen et al. (1988) .
One of the most important publications on the dangerous anthropogenic climate change is that of James Hansen and colleagues from the year 1988, in the Journal of Geophysical Research published. The le of the work is (in German translation) Global climate change, according to the prediction of the Goddard Ins ute for Space Studies.
In this publication, Hansen and colleagues present the GISS Model II, with which they simulate climate change as a result of concentration changes of atmospheric trace gases and particulate matter (aerosols). The scientists here are three scenarios:
A: increase in CO 2 emissions by 1.5% per year
B: constant increase in CO 2 emissions after 2000
C: No increase in CO 2 emissions after 2000
The CO 2 emissions since 2000 to about 2.5 percent per year has increased, so that we would expect according to the Hansen paper a temperature rise, which should be stronger than in model A. Figure 1 shows the three Hansen scenarios and the real measured global temperature curve are shown. The protruding beyond Scenario A arrow represents the temperature value that the Hansen team would have predicted on the basis of a CO 2 increase of 2.5%. Be increased according to the Hansens forecast, the temperature would have compared to the same level in the 1970s by 1.5 ° C. In truth, however, the temperature has increased by only 0.6 ° C.
It is apparent that the next to it by the Hansen group in 1988 modeled temperature prediction by about 150%. It is extremely regrettable that precisely this type of modeling of our politicians is still regarded as a reliable climate prediction.
There are currently 2 users browsing this thread. (0 members and 2 guests)
 Posting Permissions