Ennis’ latest paper is if anything more damning than it appears. He used the data from 24 state-level public pension funds. It was only 24 due to the need to have everyone use the same fiscal year end (June 30) and report performance net of costs (Ennis said 1/3 fell short on that criterion). These state funds will generally be larger and more professionally managed than smaller pension funds, particularly police and fire pension funds. In other words, the level of underperformance is certain to increase if smaller funds were included. It’s also a reasonable su ion that bigger funds that did not report returns net of fees felt the need to exaggerate their performance.
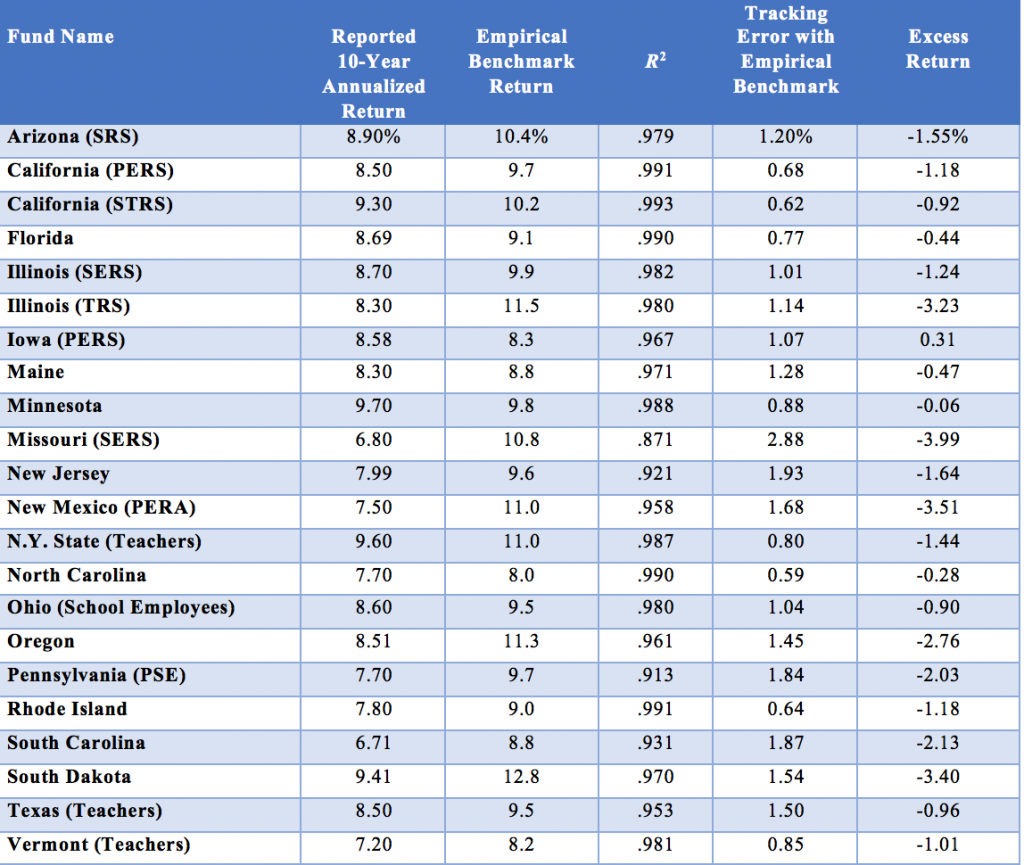
You can see Ennis’ conclusions in data form below. Negative excess returns means the funds would have done better with simple-minded indexing.
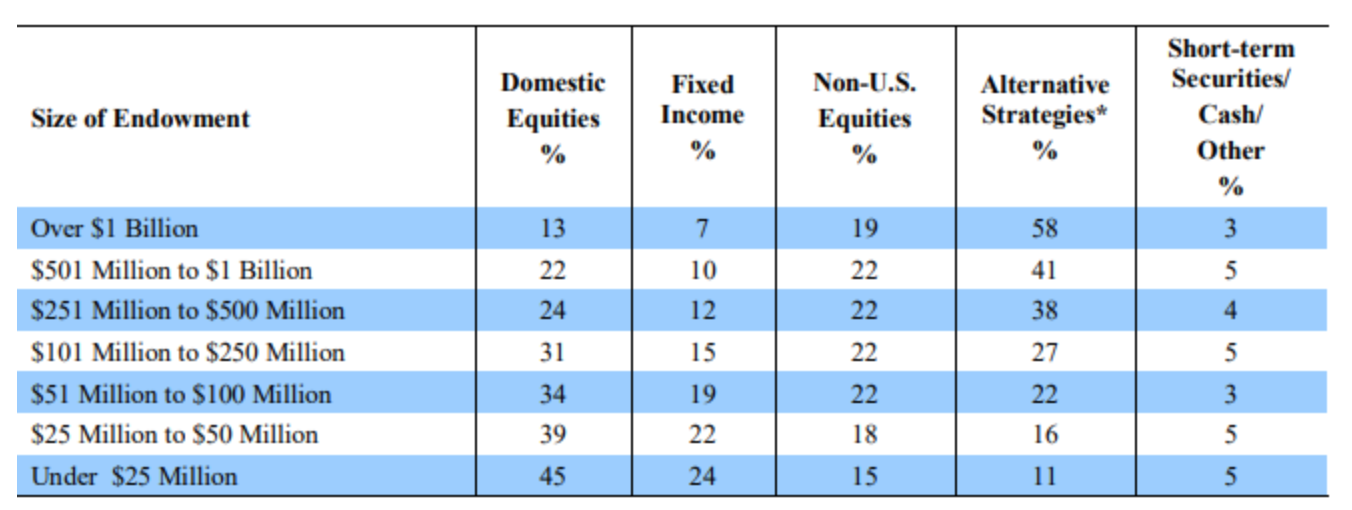
 Note again his assumptions about investment expenses are conservative. Ennis shows in Table 1 the estimated cost of investing in various alternative investment strategies. Private equity is listed at 5.7%. CalPERS is continuing to use 7% as its estimate, per board member remarks at its last public meetings.
Ennis also do ents how public pension funds lie to themselves, beneficiaries, taxpayers, and the press via flattering benchmarks. He explains how all-too-cooperative advisers feather their own beds:
Public pension funds use benchmarks of their own devising, describing them variously as “policy,” “custom,” “strategic,” or “composite” benchmarks. I refer to them as reporting benchmarks (RBs). …RBs are often opaque and difficult to replicate independently. RBs invariably include one or more active investment return series and thus are not passively investable. They are subjective in several respects, rendering their fashioning something of a black art. Moreover, they are devised by the funds’ staff and consultants, the same parties that are responsible for recommending investment strategy, selecting managers, and implementing the investment program. In other words, the benchmarkers have conflicting interests, acting as player as well as scorekeeper. To state the obvious, perhaps, RBs generally do not measure up to the standards of objectively determined, passively investable benchmarks used by scholars and serious prac ioner-researchers..
Public fund portfolios often exhibit close year-to-year tracking with their RB. This results in part from how RBs are revised over time…
No doubt the benchmarkers see such tweaking as a way of legitimizing the benchmark so that it better aligns with the actual market, asset class, and factor exposures of the fund. It accomplishes that, to be sure. But it also reduces the value of the benchmark as a performance gauge, because the more a benchmark is tailored to fit the process being measured, the less information it can provide. At some point, it ceases to be a measuring stick altogether and becomes merely a shadow.
We talk about “hugging the benchmark” in portfolio management. Here is another twist on that theme: forcing the benchmark to hug the portfolio.
Ennis uses CalPERS as a case study because its behavior is typical:
CalPERS’s portfolio return tracks that of the RB extraordinarily closely. The 10-year annualized returns differ by all of 3 bps, 8.54% versus 8.51%. Year to year, the two-return series move in virtual lockstep, as demonstrated by the measures of statistical fit—an R2 of 99.5% and tracking error of just 0.5%—and even by simple visual inspection of the annual return differences. For example, excluding fiscal years 2012 and 2013, the annual return deviations from the RB are no greater than 0.4%. This is a skintight fit.
CalPERS’s EB return series also has a close statistical fit with CalPERS’s reported returns in terms of R2 and tracking error, although not as snug a fit as with the RB. Moreover, there is an important difference in the level of returns. Whereas CalPERS’s 10-year annualized return is virtually identical to that of its RB, it underperforms the EB by 114 bps a year. And it does so with remarkable consistency: in 10 years out of 10.
The return shortfall relative to the EB is statistically significant, with a t-statistic of –2.9. And it is of huge economic significance: A 114 bp shortfall on a $470 billion portfolio is more than $5 billion a year, a sum that would fund a lot of pensions.


 Reply With Quote
 ). So after 15 years of people protesting, the massive unrest we had 9 months ago, the funds finally appear to be cracking... but after reading this thread its pretty clear whatever comes next will likely fail for the same reasons


