There are a few es in this from storm systems like the US saw over the past month, but the as you can see the long running average is now frequently below normal. We have not seen extended periods of above normal snow cover for 30 years or so.

The yearly average for 2010 snowfall anomaly is -243,000 KM2. Even with the surplus in the winter, we were well below average. 2009 was even worse, the anomaly was -379,500 KM2 per month.
I've got no problem addressing inconsistencies with the picture being presented in the media but the least you can do is provide an accurate picture based on the very same data you're providing.

There are a few es in this from storm systems like the US saw over the past month, but the as you can see the long running average is now frequently below normal. We have not seen extended periods of above normal snow cover for 30 years or so.
http://climate.rutgers.edu/snowcover...nd&ui_season=2
More data from Darrin's link above shows that winter and fall snow cover has remained fairly stable over the long run but the spring graph shows quite different results:
They dont' have a graph for the summer and I don't know why.
Its been 15 years since a positive anomaly for June and nearly 30 since consecutive years with such an anomaly.
http://www.wunderground.com/blog/Jef...?entrynum=1427Heavy snow events--a contradiction to global warming theory?
Global warming skeptics regularly have a field day whenever a record snow storm pounds the U.S., claiming that such events are inconsistent with a globe that is warming. If the globe is warming, there should, on average, be fewer days when it snows, and thus fewer snow storms. However, it is possible that if climate change is simultaneously causing an increase in ratio of snowstorms with very heavy snow to storms with ordinary amounts of snow, we could actually see an increase in very heavy snowstorms in some portions of the world. There is evidence that this is happening for winter storms in the Northeast U.S.--the mighty Nor'easters like the "Snowmageddon" storm of February 5-6 and "Snowpocalypse" of December 19, 2009. Let's take a look at the evidence. There are two requirements for a record snow storm:
1) A near-record amount of moisture in the air (or a very slow moving storm).
2) Temperatures cold enough for snow.
It's not hard at all to get temperatures cold enough for snow in a world experiencing global warming. According to the 2007 Intergovernmental Panel on Climate Change (IPCC) report, the globe warmed 0.74°C (1.3°F) over the past 100 years. There will still be colder than average winters in a world that is experiencing warming, with plenty of opportunities for snow. The more difficult ingredient for producing a record snowstorm is the requirement of near-record levels of moisture. Global warming theory predicts that global precipitation will increase, and that heavy precipitation events--the ones most likely to cause flash flooding--will also increase. This occurs because as the climate warms, evaporation of moisture from the oceans increases, resulting in more water vapor in the air. According to the 2007 Intergovernmental Panel on Climate Change (IPCC) report, water vapor in the global atmosphere has increased by about 5% over the 20th century, and 4% since 1970. This extra moisture in the air will tend to produce heavier snowstorms, assuming it is cold enough to snow. Groisman et al. (2004) found a 14% increase in heavy (top 5%) and 20% increase in very heavy (top 1%) precipitation events in the U.S. over the past 100 years, though mainly in spring and summer. However, the authors did find a significant increase in winter heavy precipitation events have occurred in the Northeast U.S. This was echoed by Changnon et al. (2006), who found, "The temporal distribution of snowstorms exhibited wide fluctuations during 1901-2000, with downward 100-yr trends in the lower Midwest, South, and West Coast. Upward trends occurred in the upper Midwest, East, and Northeast, and the national trend for 1901-2000 was upward, corresponding to trends in strong cyclonic activity."
The strongest cold-season storms are likely to become stronger and more frequent for the U.S.
The U.S. Global Change Research Program (USGCRP) began as a presidential initiative in 1989 and was mandated by Congress in the Global Change Research Act of 1990 (P.L. 101-606), which called for "a comprehensive and integrated United States research program which will assist the Nation and the world to understand, assess, predict, and respond to human-induced and natural processes of global change." This program has put out some excellent peer-reviewed science on climate change that, in my view, is as authoritative as the U.N.-sponsored Intergovernmental Panel on Climate Change (IPCC) reports. In 2009, the USGCRP put out its excellent U.S. Climate Impacts Report, summarizing the observed and forecast impacts of climate change on the U.S. The report's main conclusion about cold season storms was " Cold-season storm tracks are shifting northward and the strongest storms are likely to become stronger and more frequent".
The report's more detailed analysis: "Large-scale storm systems are the dominant weather phenomenon during the cold season in the United States. Although the analysis of these storms is complicated by a relatively short length of most observational records and by the highly variable nature of strong storms, some clear patterns have emerged (Kunkel et al., 2008).
Storm tracks have shifted northward over the last 50 years as evidenced by a decrease in the frequency of storms in mid-la ude areas of the Northern Hemisphere, while high-la ude activity has increased. There is also evidence of an increase in the intensity of storms in both the mid- and high-la ude areas of the Northern Hemisphere, with greater confidence in the increases occurring in high la udes (Kunkel et al., 2008). The northward shift is projected to continue, and strong cold season storms are likely to become stronger and more frequent, with greater wind speeds and more extreme wave heights". The study also noted that we should expect an increase in lake-effect snowstorms over the next few decades. Lake-effect snow is produced by the strong flow of cold air across large areas of relatively warmer ice-free water. The report says, "As the climate has warmed, ice coverage on the Great Lakes has fallen. The maximum seasonal coverage of Great Lakes ice decreased at a rate of 8.4 percent per decade from 1973 through 2008, amounting to a roughly 30 percent decrease in ice coverage. This has created conditions conducive to greater evaporation of moisture and thus heavier snowstorms. Among recent extreme lake-effect snow events was a February 2007 10-day storm total of over 10 feet of snow in western New York state. Climate models suggest that lake-effect snowfalls are likely to increase over the next few decades. In the longer term, lake-effect snows are likely to decrease as temperatures continue to rise, with the precipitation then falling as rain".
Commentary
Of course, both climate change contrarians and climate change scientists agree that no single weather event can be blamed on climate change. However, one can "load the dice" in favor of events that used to be rare--or unheard of--if the climate is changing to a new state. It is quite possible that the dice have been loaded in favor of more intense Nor'easters for the U.S. Mid-Atlantic and Northeast, thanks to the higher levels of moisture present in the air due to warmer global temperatures. It's worth mentioning that heavy snow storms should be getting increasingly rare for the extreme southern portion of the U.S. in coming decades. There's almost always high amounts of moisture available for a potential heavy snow in the South--just not enough cold air. With freezing temperatures expected to decrease and the jet stream and associated storm track expected to move northward, the extreme southern portion of the U.S. should see a reduction in both heavy and ordinary snow storms in the coming decades.
The CapitalClimate blog has a nice perspective on "Snowmageddon", and Joe Romm of climateprogress.org has some interesting things to say about snowstorms in a warming climate.
References
Changnon, S.A., D. Changnon, and T.R. Karl, 2006, , "Temporal and Spatial Characteristics of Snowstorms in the Contiguous United States", J. Appl. Meteor. Climatol., 45, 1141.1155.
Groisman, P.Y., R.W. Knight, T.R. Karl, D.R. Easterling, B. Sun, and J.H. Lawrimore, 2004, "Contemporary Changes of the Hydrological Cycle over the Contiguous United States: Trends Derived from In Situ Observations," J. Hydrometeor., 5, 64-85.
Kunkel, K.E., P.D. Bromirski, H.E. Brooks, T. Cavazos, A.V. Douglas, D.R. Easterling, K.A. Emanuel, P.Ya. Groisman, G.J. Holland, T.R. Knutson, J.P. Kossin, P.D. Komar, D.H. Levinson, and R.L. Smith, 2008: Observed changes in weather and climate extremes. In: Weather and Climate Extremes in a Changing Climate: Regions of Focus: North America, Hawaii, Caribbean, and U.S. Pacific Islands [Karl, T.R., G.A. Meehl, C.D. Miller, S.J. Hassol, A.M. Waple, and W.L. Murray (eds.)]. Synthesis and Assessment Product 3.3. U.S. Climate Change Science Program, Washington, DC, pp. 35-80.

I don't think we fully understand what is causing that. That's all I'm trying to say.
We're on a 12-year period with no appreciable warming. There was a 30 year period between about 1940 to 1970 where there was no appreciable warming (even though CO2 was climbing rapidly during that time). Yes, it is assinine to talk about one severe winter as if it means something. But it is equally assinine for NASA to come out and say 2010 is tied for the 2nd,3rd (whatever is is) hottest year, as if THAT means something.
I'm extremely curious about that Berkely study. Perhaps they will develop the "gold standard" temperature record.
Just being a smartass. Beats the out of talking about Bill O'Reilly.

Link? data?
I see you have made that claim more than once, with no support for it yet.
Global surface temperatures have increased about 0.74°C (plus or minus 0.18°C) since the late-19th century, and the linear trend for the past 50 years of 0.13°C (plus or minus 0.03°C) per decade is nearly twice that for the past 100 years. The warming has not been globally uniform. Some areas (including parts of the southeastern U.S. and parts of the North Atlantic) have, in fact, cooled slightly over the last century. The recent warmth has been greatest over North America and Eurasia between 40 and 70°N. Lastly, seven of the eight warmest years on record have occurred since 2001 and the 10 warmest years have all occurred since 1995.
Despite this thread, I don't follow everything, but am unaware of any recent cooling.
All temperature records besides GISS show no appreciable warming since 98.
Second verse, same as the first...
We went through this, ending with your "I measured temerature in two different offices" attempt to prove how little things have changed recently.
I think your confirmation bias leads you to look at the data in terms that are far too absolute. "the total scale of change is small or negligible" rather than on a relative scale.
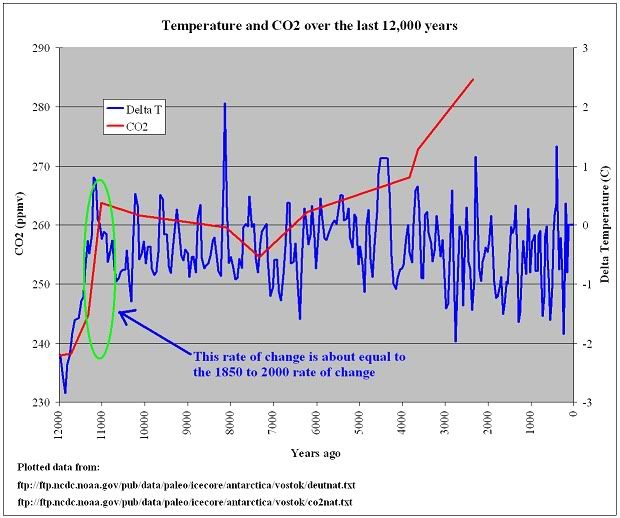
As I have pointed out previously, we will emit more CO2 in the next 28 years or so than we did in the previous 76-100. Given the amount that overall CO2 atmospheric ppm has changed with that,
We have data about 20 ppm increase in 3,000 years. (+1 ppm per 150 years)
(you know the one you attributed to ancient Egyption SUV's)
but then recently like 70 ppm in 50 years? (+1 ppm per 8.5 months) (1960 to 2010)
??
Sure mankind's emissions of CO2 are small compared to what nature does. If the system was in a rough equilibrium before, and you add more CO2 than the climate system can absorb, is it not logical that the extra CO2 will simply stick around?
This suggests to me that we have barely begun to see what happens when you add a LOT of CO2 to the air. Add in another 70+ ppm increase in the next 24 years, (total guess) and the effects will be a whole lot more noticible and harder to deny each year.
ah yes. the "absolute terms"
But this period has been on average warmer than most of the years that preceded it, correct?
Seems to me you are, yet again, cherry picking the way the data is presented or what data is presented.
You can call it cherry picking, but it is what it is -- 12 years. Another 12 years without warming, and we're talking about a quarter century with no statistically significant warming.

Summary of this thread.
"Here's a graph/chart/text i found from a google search result agreeing with my thoughts"
"Here's a graph/chart/text i found from a google search result disagreeing with your thoughts"
"Here's more data that says you're an assclown"
"Teabaggers"
"Obumma"
Come to think about it, that's pretty much every discussion on the internet. Funny how little some people actually know if they can't look it up. Not any of you guys personally on this thread, just an observation in general.

Liar.
I don't deny climate change.
I demand proper evidence that the AGW theory is correct. To date, it should still only be a hypothesis. Scientifically, it does not meet the definition as a theory.
My God...
Do you realize how foolish you are making yourself look? If you understood what I am saying, implying, etc... you wouldn't be making such idiotic statements.
No Sherlock. You are too stupid to calculate it yourself, so how can you be smart enough to think you are getting over on me?
You are owning yourself royally!
Mg/Ca is a method, accurate to +/- 2.5 C for warmer temperature areas, and is less accurate below 5 C.
Did you research that method at all? The reason it is only accurate to a couple degrees is because of the unknown other variables. There is still controversy as to what the correct formula to use is, because the results vary so much.
Random...
I just spent the last hour carefully reading all my posts about this 2,000 year warming paper. No place do I state that the waters did not warm, not that the paper might have a correct conclusion in the end.
Again, you keep assuming my argument is different than what it is, making you very laughable.
As for the 13C and 18O, I went off on that after you brought it up. If they didn't do the 18O testing, then the paper is even more lame than I believed.
My argument is simple. Too many variables that cannot be quantified. It's hard enough to predict past water temperatures in non glacier areas. The melting of unknown time slices of glacier ice and ice caps of unknown age seriously throws all into uncertainty.
LOL...
Please...
Don't tell me they are that stupid...
Light oxygen?
Consider this:
The Mg/Ca paleotemperature proxy is not without complications. Foraminiferal calcite is susceptible to dissolution, diagenesis, and seawater carbon chemistry potentially obscuring the original temperature signal. Because the Mg cation destabilizes the crystal lattice, dissolution lowers the Mg/Ca ratio of some species (Dekens et al., 2002). Recrystallization of carbonate in the sediments, on the other hand, may add inorganic calcite, which has a higher par ion coefficient than biotic calcite and may add Mg-rich carbonate to a test (Morse and Bender, 1990).
One oxygen isotope has a higher molecular weight than the other common isotope. I forget the numbers but the point is that climate conditions affect the amount of each given isotope at various places around the globe. Its a useful proxy.
True, I agree.
But testing for "light" oxygen isotopes?
Have you see what their half-life is?
The longest lived "light" oxygen isotope has a half-life of about 2 minutes.
The ability to look things up is really amazing. I love the internet.
Re-read what I said. I said they didn't specify exactly how much time each slice was that I could find.They didn't really say within the study how much time the 1/2 cm slice was that I could find.
Tell me, what do you think it was?
I didn't say I didn't know, or couldn't calculate it from what they did say. Those are both your assumptions, because you want to think that someone who disagrees with you is less intelligent because they disagree with you.
Let me be a bit more specific then:
I did note that it could be calculated from their description of their work. I haven't taken the time to do so.
If it means that much to you that I calculate it, I will do so.
and yes, I know where you are going with this line of reasoning. but hey, by all means, make your case.
Of course you went off on it after I brought it up. I was simply guessing as to what they were doing based on the limited information I had. I admitted that I had not read the methodogy and was speculating. You were perfectly content with dismissing the study out of hand without evaluating the methodology or underlying science involved.
Unfortunately "too many variables that cannot be quantified" sounds su iously like "This poses a threat to my world view, so I will dismiss it outright". This is the quality of argument that most creationsists make.
The lead researcher has a PhD, and has spent 25 years studying this. He seems to be of the opinion that reasonable conclusions can be drawn from the samples he and his teem took.
As for "unknown time slices of glacier ice" ??? You still haven't read the study in its entirety? The samples they took were of ocean bottom sediments, not ice.
I have asked you to be specific as possible in all of your responses. Why do you keep insisting on speaking in hand-wavy generalities like this?
I am seriously beginning to suspect you are deliberately avoiding specifics, because you don't really know enough to do so.
Indeed. "complications" does not mean that the method is invalid on its face.
It simply means that one has to be careful and precise, and mindful of complicating factors.
All of the potential complicating factors were addressed in the study's methodology description.
They also mentioned quite a bit of other supporting material, that is probably out of your field of expertise, no offense.
Basically all of your arguments boil down to:
"Take my word for it, they are all bunk"
Yet you are much less qualified in the field of biology, or geology than the Phd's, grad students, and people who actually publish scientific papers in this field. A good chunk of this is in basic chemistry, but how that chemistry applies to the biological and geological processes is, as far as I have seen, outside your area of expertise.
You are attempting to do a peer review on a paper you didn't bother to read, in a field outside your area of expertise, and are asking me to accept your word on it over people who know more about it, and study it full time. Further, you are doing it in a blatantly dogmatic way.
Sorry, but no thanks. There is a difference between honest skepticism and pseudoscientific hackery, and your dismissal of these methods smacks of the same kind of blanket dismissals of radiocarbon dating that creationists have to fall back on to cling to their irrational beliefs.
Last edited by RandomGuy; 02-12-2011 at 05:05 PM.
There are currently 8 users browsing this thread. (0 members and 8 guests)
 Posting Permissions