Page 47 of 161 FirstFirst ... 374344454647484950515797147 ... LastLast
Results 1,151 to 1,175 of 4001
  1. #1151
    I am that guy RandomGuy's Avatar
    My Team
    San Antonio Spurs
    Join Date
    Jun 2005
    Post Count
    50,681
    LOL...

    You only try to pick apart the lesser ones. Not the ones with real substance.

    Guess you are incapable of that.
    "try" Funny word.

    Do you still stand by your assertion that, "if there were so many nutrients in the water, the temperature wouldn't matter"?
    RandomGuy is offline

  2. #1152
    Veteran Wild Cobra's Avatar
    My Team
    Portland Trailblazers
    Join Date
    May 2007
    Post Count
    43,117
    Unfortunately "too many variables that cannot be quantified" sounds su iously like "This poses a threat to my world view, so I will dismiss it outright". This is the quality of argument that most creationsists make.
    You simply don't get it, do you. To isolate one unknown in a mathematical formula, you have to account for the other variables. They have absolutely no way to account for some of the unknowns.
    The lead researcher has a PhD, and has spent 25 years studying this. He seems to be of the opinion that reasonable conclusions can be drawn from the samples he and his teem took.
    Opinion... Reasonable conclusion?

    At what statistical accuracy?
    As for "unknown time slices of glacier ice" ??? You still haven't read the study in its entirety? The samples they took were of ocean bottom sediments, not ice.
    Duh... I do comprehend these things. You obviously do not understand that these Plankton being studied live in the water, and their nutrients are subject to all kinds of changes. Changing volumes of glacier ice and ice caps melting throw in factors that isn't a problem in other areas of the world.
    I have asked you to be specific as possible in all of your responses. Why do you keep insisting on speaking in hand-wavy generalities like this?
    My statements stand by themselves. Not my problem you are ignorant to why they apply.
    I am seriously beginning to suspect you are deliberately avoiding specifics, because you don't really know enough to do so.
    I don't need to be specific. All I need to do is point out factors that throw off the study.
    Wild Cobra is offline

  3. #1153
    Veteran Wild Cobra's Avatar
    My Team
    Portland Trailblazers
    Join Date
    May 2007
    Post Count
    43,117
    All of the potential complicating factors were addressed in the study's methodology description.
    Bull .
    Wild Cobra is offline

  4. #1154
    Veteran Wild Cobra's Avatar
    My Team
    Portland Trailblazers
    Join Date
    May 2007
    Post Count
    43,117
    "try" Funny word.

    Do you still stand by your assertion that, "if there were so many nutrients in the water, the temperature wouldn't matter"?
    I don't recall exactly what I said, but my point is that temperature is not the only thing that allows for growth. I explained other possibilities as well.

    Have they ruled out everything I mentioned?

    I think not.
    Wild Cobra is offline

  5. #1155
    I am that guy RandomGuy's Avatar
    My Team
    San Antonio Spurs
    Join Date
    Jun 2005
    Post Count
    50,681
    I don't recall exactly what I said, but my point is that temperature is not the only thing that allows for growth. I explained other possibilities as well.

    Have they ruled out everything I mentioned?

    I think not.
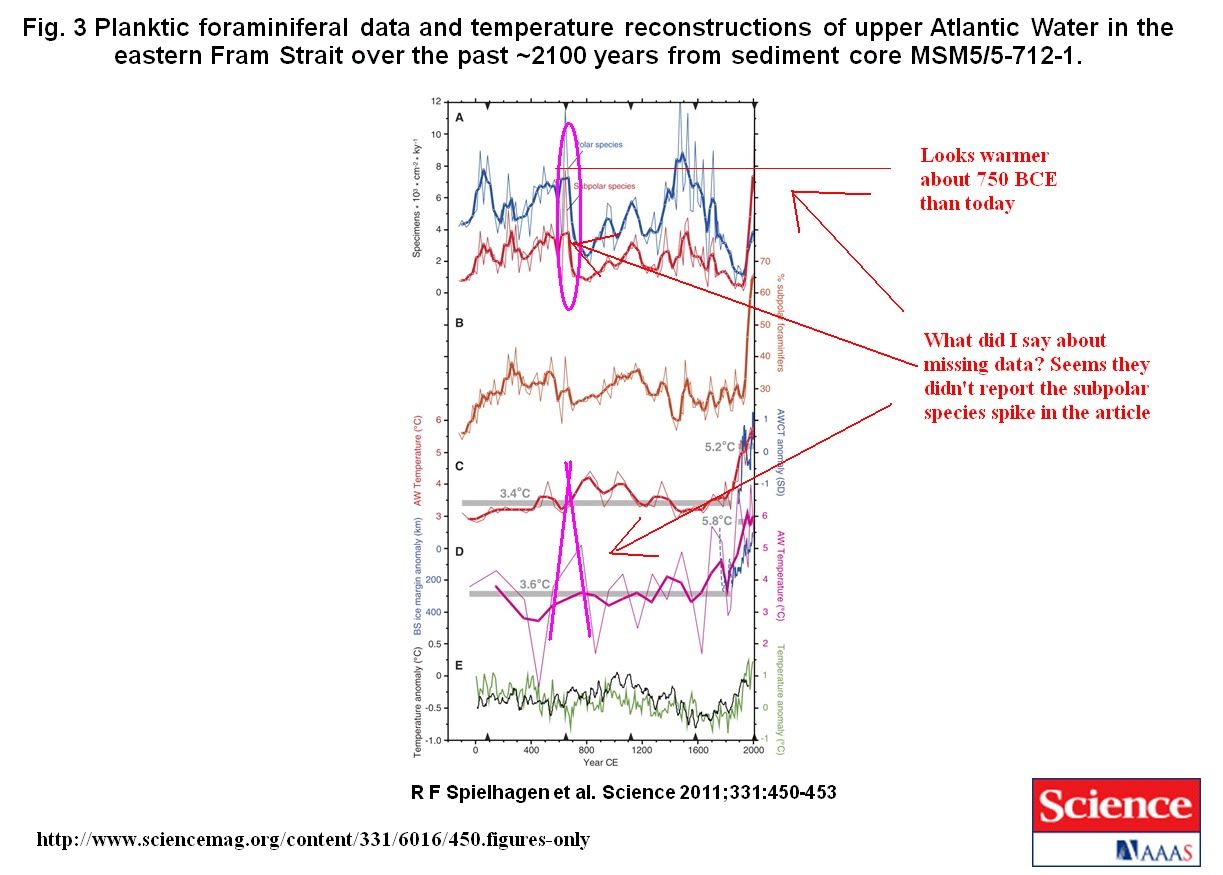
    You were attempting to support your annotation on the graph, "it was hotter in 750 BCE than today", by showing a e in the graph of warm-loving florimifera at concentrations higher than present day.

    To reach this conclusion, you ignored the distict and parallel e in cold-loving species, that indicates it was simply an anomolous e in the data.

    Another [possibility] is that nutrients they share in common were so abundant that a temperature that would normally curtail one's growth didn't matter.
    This ignores the principle of natural selection, where one species will out compete another if it is more suited for environmental conditions found.


    I would then ask, if the principle of natural selection holds, what is a reasonable conclusion to draw from this data set, given that the only difference in suitability between the polar species and the subpolar species is their affinity for certain temperatures?
    RandomGuy is offline

  6. #1156
    I am that guy RandomGuy's Avatar
    My Team
    San Antonio Spurs
    Join Date
    Jun 2005
    Post Count
    50,681
    I don't need to be specific. All I need to do is point out factors that throw off the study.
    Cosmored, you say they got moon rocks using robotic probes, can you show me specificallly what kind of 1960's design would work?

    We have no idea what kind of classified technology they had. If they were able to soft-land the Surveyor probes, some kind of remote-control technology existed. [translation: No I can't get you a specific answer]
    Cosmored, you say that all the papers on those moon rocks were faked, and the scientists were "in on it".

    They're not impossible to fake. All they have to do is lie and publish the lie. I showed how it's possible for the government to get scientists to lie on a large scale in this post.
    http://www.spurstalk.com/forums/show...postcount=1090
    And they have redefined what peer review is, that's why their material is not trustworthy.
    Cosmored, can you tell me how they faked all the telemetry data going into the mission control during the moonshots, if they were faked?

    I don't need to be specific. All I need to do is point out factors that throw off your theory that they were real.
    Cosmored, can you tell me exactly how this conspiracy has managed to keep things secret for so long?

    I don't need to be specific. All I need to do is point out factors that throw off your theory that they were real.
    Cosmored, can you tell me who was in on the conspiracy?

    I don't need to be specific. All I need to do is point out factors that throw off your theory that they were real.
    Your "they won't explain my factors" schtick starts sounding an awful lot like Cosmoreds "plausible explanations".
    Last edited by RandomGuy; 02-14-2011 at 02:39 PM.
    RandomGuy is offline

  7. #1157
    I am that guy RandomGuy's Avatar
    My Team
    San Antonio Spurs
    Join Date
    Jun 2005
    Post Count
    50,681
    Consider this:
    "The Mg/Ca paleotemperature proxy is not without complications."
    Indeed. "complications" does not mean that the method is invalid on its face.

    It simply means that one has to be careful and precise, and mindful of complicating factors.

    All of the potential complicating factors were addressed in the study's methodology description.
    For Mg/Ca analysis ~50 tests of N. pachyderma (sin.) per sample were picked from the 100-150 μm fraction. The size interval was kept narrow in order to avoid a possible size dependent bias (S6). In preparation of Mg/Ca measurements, foraminifers were gently crushed between glass slides. Subsequently each sample underwent the trace metal cleaning procedures described elsewhere (S7, S8). Samples were analyzed for Mg/Ca by magnetic sector single-collector ICP-MS on a Thermo-Finnigan Element2, using methods adapted from Rosenthal et al. (S9) with a long-term 1σ precision of Mg/Ca for of 0.5% (S10). Four samples were rejected due to low post-cleaning mass recovery (< 5μg CaCO3) (S10), leaving a total of 26 reliable Mg/Ca data (including two replicates). Elemental ratios of Fe/Ca and Al/Ca (detrital material) and Mn/Ca (secondary diagenetic coatings) were analyzed coincidental with Mg/Ca. No values of Mn/Ca exceeded 24 μmol mol-1, which is well below the threshold for likely trace metal contamination (S11). One sample (0.25 cm) had Fe/Ca and Al/Ca values exceeding 100 μmol mol-1. However, this single sample was not omitted as its Mn/Ca ratio did not show signs of contamination and its Mg/Ca value was similar to surrounding samples.

    To convert the measured Mg/Ca ratios into temperatures we used the N. pachyderma equation of Elderfield and Ganssen (S12): Mg/Ca (mmol mol-1) = 0.5 exp 0.10 T. This equation is indistinguishable from the Norwegian Sea N. pachyderma (sin.) calibration of Nürnberg (S13)
    and the cultured N. pachyderma (dex.) calibration of von Langen et al. (S14). Application of an alternative equation of Kozdon et al. (S15) results in consistently lower temperatures throughout the core which are also lower than the SIMMAX results. Tests from the upper 10 cm of the core showed some signs of dissolution and were fragile. Generally, partly dissolved tests should be avoided as they may give too low Mg/Ca ratios and the reconstructed temperatures may be underestimated (S16). With respect to core MSM5/5-712-1, however, we regard the close similarity between temperatures reconstructed from independent SIMMAX and Mg/Ca results as evidence of a minor effect of dissolution.

    Were dissolution of importance, it would affect also the planktic foraminifer associations used
    for SIMMAX. Fragile subpolar species would be more easily dissolved than the only polar, robust species N. pachyderma (sin.), eventually leading to lower calculated SIMMAX temperatures especially for the youngest time interval. Thus, carbonate dissolution within the uppermost part of the core would result in an underestimation (by both methods) of the Atlantic Water temperature difference between the Modern (Industrial) Period and, e.g., the Medieval Climate Anomaly.

    Replicate Mg/Ca analysis on separate picks at 0 cm and 28 cm core depth revealed differences of 0.01 mmol mol-1 and 0.12 mmol mol-1, respectively. Although this is insufficient to provide a robust estimate of reproducibility, a pooled standard deviation of order 0.05-0.1 mmol mol-1 is typical for foraminifera (e.g., Refs. S17, S18). The standard deviation for each interval before and after AD 1850 was 0.1 mmol mol-1, which translates to relatively large temperature ranges at the cold end of the Elderfield and Ganssen (S12) exponential calibration: +1.3/-1.5C pre-industrial and +1.1/-1.2C post-industrial. Since this is close to our estimated reproducibility, we cannot interpret the temperature variability within each interval, which we suggest is dominated by random error. However the mean within each interval is well constrained, with standard errors (stdev/sqrt[n]) of ±0.3C pre-industrial and ±0.5C post-industrial.
    They discussed dissolution, proper cleaning of the tests, multiple nearby soil samples to get a baseline for sedimentary mineral composition, and several other factors that would require more reading of studies.

    Your "consider this" link discussed quite a few professional papers, that one would assume that a researcher with 25 years experience of studying arctic basin geology/biology would presumedly be aware.

    I will at this point re-state my earlier assertion with a rather important qualifier:

    All of the potential complicating factors appear to me to be addressed in the study's methodology description.

    Can you tell me which exact "complication" or "factor" that you feel they did not address?
    RandomGuy is offline

  8. #1158
    Veteran
    My Team
    San Antonio Spurs
    Join Date
    Mar 2009
    Post Count
    97,518
    Nothing is decided. Needs more studies (showing Kock Bros bogus-science-for-hire).

    --WC

    Kock Bros are worth $35B, and they don't care if they turn the entire US into a Lake-Charles-LA-style disease cluster.
    boutons_deux is offline

  9. #1159
    Hey Bruce... Lebron is the Rock Sec24Row7's Avatar
    My Team
    San Antonio Spurs
    Join Date
    Nov 2004
    Post Count
    3,118
    Nothing is decided. Needs more studies (showing Kock Bros bogus-science-for-hire).

    --WC

    Kock Bros are worth $35B, and they don't care if they turn the entire US into a Lake-Charles-LA-style disease cluster.
    Scientists are herd animals... and ALL of them are for hire... otherwise they would starve.
    Sec24Row7 is offline

  10. #1160
    Veteran Wild Cobra's Avatar
    My Team
    Portland Trailblazers
    Join Date
    May 2007
    Post Count
    43,117
    You were attempting to support your annotation on the graph, "it was hotter in 750 BCE than today", by showing a e in the graph of warm-loving florimifera at concentrations higher than present day.
    That's your problem. You keep misreading what I say and imply intent I never said. I never said it was hotter! I said it could have been.
    To reach this conclusion, you ignored the distict and parallel e in cold-loving species, that indicates it was simply an anomolous e in the data.
    I explained a possibility why both were in the same sample. You ignore what I say. Are you hard headed, a total fool, or what?
    This ignores the principle of natural selection, where one species will out compete another if it is more suited for environmental conditions found.

    Idiot. That graph is percentage. They both cannot add up to greater than 100%.
    I would then ask, if the principle of natural selection holds, what is a reasonable conclusion to draw from this data set, given that the only difference in suitability between the polar species and the subpolar species is their affinity for certain temperatures?
    Go back, I explained a possibility why that occurred in the data.
    Wild Cobra is offline

  11. #1161
    Veteran Wild Cobra's Avatar
    My Team
    Portland Trailblazers
    Join Date
    May 2007
    Post Count
    43,117
    They discussed dissolution, proper cleaning of the tests, multiple nearby soil samples to get a baseline for sedimentary mineral composition, and several other factors that would require more reading of studies.

    Your "consider this" link discussed quite a few professional papers, that one would assume that a researcher with 25 years experience of studying arctic basin geology/biology would presumedly be aware.

    I will at this point re-state my earlier assertion with a rather important qualifier:

    All of the potential complicating factors appear to me to be addressed in the study's methodology description.

    Can you tell me which exact "complication" or "factor" that you feel they did not address?
    Yes I know. That still doesn't address a changing recrystallization, or other possibilities.

    Why are you arguing to their accuracy? I am only saying the study cannot be accepted at face value, pointed out some reasons why, but you act as if you would bet your life on it.
    Wild Cobra is offline

  12. #1162
    I am that guy RandomGuy's Avatar
    My Team
    San Antonio Spurs
    Join Date
    Jun 2005
    Post Count
    50,681
    That's your problem. You keep misreading what I say and imply intent I never said. I never said it was hotter! I said it could have been.
    I have not done that to my knowledge. In all cases, I have tried to be as fair and accurate as possible when it comes to charactorizing/restating what it is you say, or what I believe you are saying.


    You didn't say "could have" been. You said "looks warmer 750 BCE than today".

    If you had bothered reading the entire study, you would also have known that ultimately, they didn't include the polar species e because the relative proportions of the two species remained in line with all the other data, even if that sample draw had a higher concentration of overall organisms.

    This particular bit simply reinforces my belief that you don't really understand the science behind this field of study as much as you would have me/us believe.
    RandomGuy is offline

  13. #1163
    I am that guy RandomGuy's Avatar
    My Team
    San Antonio Spurs
    Join Date
    Jun 2005
    Post Count
    50,681
    To reach this conclusion, you ignored the distict and parallel e in cold-loving species, that indicates it was simply an anomolous e in the data.
    I explained a possibility why both were in the same sample. You ignore what I say. Are you hard headed, a total fool, or what?
    You explained a possibility, yes.

    What you don't seem to be able to comprehend is that the possibility you mentioned, i.e. "so many nutrients in the water that temperature didn't matter" is irreconcilable with the principles of natural selection, if you are attempting to say "it looks warmer than today".

    IF the water was "warmer than today" then you would see the warm-loving species simply outcompete the cold-loving species, because they would have a decided reproductive advantage.

    This is what we see today, where the proportions have inverted from all the sampled norms found in the core sample.

    For your "possibility" to be valid and it was "warmer than today" in that sample, one of the fundamental principles of biology and evolutionary theory would have to be proven not to hold.

    Are you attempting to disprove the process of natural selection?
    RandomGuy is offline

  14. #1164
    I am that guy RandomGuy's Avatar
    My Team
    San Antonio Spurs
    Join Date
    Jun 2005
    Post Count
    50,681


    Idiot. That graph is percentage. They both cannot add up to greater than 100%.
    Thank you, Captain Obvious.

    Your point is?
    RandomGuy is offline

  15. #1165
    I am that guy RandomGuy's Avatar
    My Team
    San Antonio Spurs
    Join Date
    Jun 2005
    Post Count
    50,681
    Yes I know. That still doesn't address a changing recrystallization, or other possibilities.

    Why are you arguing to their accuracy? I am only saying the study cannot be accepted at face value, pointed out some reasons why, but you act as if you would bet your life on it.
    The changing recrystallization seems to have been addressed when they compared the core sample to nearby geology. They also mentioned that.

    Since you are grasping for these, here are a few:


    Nothing you have said convinces me that you know more than the biologists and geologists conducting the study.

    Sorry.

    Unless you care to pull some "other possiblities" out of your ass? I doubt they will stink any less than what you are shoveling now.
    RandomGuy is offline

  16. #1166
    Garnett > Duncan sickdsm's Avatar
    My Team
    Minnesota T'Wolves
    Join Date
    Aug 2003
    Post Count
    3,976
    The ability to look things up is really amazing. I love the internet.
    It is amazing. But its also a downfall to learning the old way. I would venture to say that alot of threads like these, the graph's, charts and info are used to try to only cement ones opinion. A year or two from now, that info is lost on most because of WHY we looked that up.


    I haven't read much of this thread. I really doubt you or anyone else active in this thread here has changed their opinion though, mainly because of how long it is.
    sickdsm is offline

  17. #1167
    Veteran Wild Cobra's Avatar
    My Team
    Portland Trailblazers
    Join Date
    May 2007
    Post Count
    43,117
    I have not done that to my knowledge. In all cases, I have tried to be as fair and accurate as possible when it comes to charactorizing/restating what it is you say, or what I believe you are saying.
    Bull .
    You didn't say "could have" been. You said "looks warmer 750 BCE than today".
    So I could have been less ambiguous on the graphics text I added. Everywhere else, I never said it was, only words to the effect that it could have been. My God... I'm guilty of not using enough words. OK...

    It looks like it could have been warmer about 750 BCE.

    Please...

    Don't tell me you are not misrepresenting my intent, when I have always used less pointed words in the rest of my argument.

    You are definitely distorting my intent.

    You!
    If you had bothered reading the entire study, you would also have known that ultimately, they didn't include the polar species e because the relative proportions of the two species remained in line with all the other data, even if that sample draw had a higher concentration of overall organisms.
    Yep, throw out data that doesn't fit their 1 sigma world. That's fine when ruling out similar data from multiple samples, but with an approximate 47 year slice, that data may have been correct.

    Remember, this is all from just one location's data.
    This particular bit simply reinforces my belief that you don't really understand the science behind this field of study as much as you would have me/us believe.
    What ever you want to believe. No skin off my back.

    Let me ask you this? Do you understand (before looking it up like I bet you will) what 1 sigma, 2 sigma, 3 sigma, etc. represent in statistical sampling?
    Wild Cobra is offline

  18. #1168
    I am that guy RandomGuy's Avatar
    My Team
    San Antonio Spurs
    Join Date
    Jun 2005
    Post Count
    50,681
    Let me ask you this? Do you understand (before looking it up like I bet you will) what 1 sigma, 2 sigma, 3 sigma, etc. represent in statistical sampling?
    Yes I do, and no I didn't have to look it up. Statistical sampling is something I use at my job, and something I am pretty familiar with.

    Which is why I know enough to think your blathering about "single sigma methodology" is disengenuous.
    Last edited by RandomGuy; 02-16-2011 at 11:11 AM.
    RandomGuy is offline

  19. #1169
    I am that guy RandomGuy's Avatar
    My Team
    San Antonio Spurs
    Join Date
    Jun 2005
    Post Count
    50,681
    So I could have been less ambiguous on the graphics text I added. Everywhere else, I never said it was, only words to the effect that it could have been. My God... I'm guilty of not using enough words. OK...

    It looks like it could have been warmer about 750 BCE.

    Please...

    Don't tell me you are not misrepresenting my intent, when I have always used less pointed words in the rest of my argument.

    You are definitely distorting my intent.

    You!
    Your implication, whether the "could" was added or not, was not supported by the data.

    You looked at only the part of the graph that you thought it looked like it supported your assertion,i.e. the e in warm-loving species concentration while ignoring the part that didn't, i.e. the e in cold-loving species concentration.


    The e you were looking at still fell within reasonable margins, proportionally, as the other historical norms, indicating cooler temperatures, given the predominance of cold-loving species.

    The *only* way to think that is to either misunderstand the data, or not incorporate the principle of natural selection into your thinking.

    Sorry.
    RandomGuy is offline

  20. #1170
    Veteran Wild Cobra's Avatar
    My Team
    Portland Trailblazers
    Join Date
    May 2007
    Post Count
    43,117
    Your implication, whether the "could" was added or not, was not supported by the data.

    You looked at only the part of the graph that you thought it looked like it supported your assertion,i.e. the e in warm-loving species concentration while ignoring the part that didn't, i.e. the e in cold-loving species concentration.


    The e you were looking at still fell within reasonable margins, proportionally, as the other historical norms, indicating cooler temperatures, given the predominance of cold-loving species.

    The *only* way to think that is to either misunderstand the data, or not incorporate the principle of natural selection into your thinking.

    Sorry.
    No, a large temperature change could have happened during that time slice in the core sample. Some other event as well could have happened. Then this percentage graph you provide is of only a specific size, separating them by specific species. Not just polar and subpolar.

    I won't pretend to have all the answers. Again, I am calling the study into question. You are supporting it without an ounce of skepticism.
    Wild Cobra is offline

  21. #1171
    I am that guy RandomGuy's Avatar
    My Team
    San Antonio Spurs
    Join Date
    Jun 2005
    Post Count
    50,681
    No, a large temperature change could have happened during that time slice in the core sample. Some other event as well could have happened. Then this percentage graph you provide is of only a specific size, separating them by specific species. Not just polar and subpolar.

    I won't pretend to have all the answers. Again, I am calling the study into question. You are supporting it without an ounce of skepticism.
    *could have* indeed.

    I will readily admit:

    There is a potential that there may have been, within the last 2000 years, a short-lived increase in temperature of waters flowing into the artic over this point.

    The increase in temperatures would have to have been short-lived simply because if it had been longer than a few years it would have severely skewed the data, and produced proportions inconsistant with the rest of the data found.

    The methodology of the study "lumps" periods of time together to get what amounts to averages over those periods of time. A short-lived e would be undetected by this study.

    In this, your specific criticism is technically valid.

    Such a short-lived e, though, would be accompanied by other indicators, like sudden drops in ice cover. As noted previously, the study's author has been studying the arctic and its environment, such as ice cover, for 25 years. I presume he would be cognizant of such things.

    The recent e though appears to be sustained enough to start showing up in the sediments such as looked at here.

    I don't find the study's conclusion all that unreasonable, though. Given that the most recent layers seem to have parameters FAR out of that which appears to be normal does mean we can make some reasonable assumptions.

    As I said have before, there is a vast gulf between honest skepticism and dogmatic dimissals of entire fields of study.
    RandomGuy is offline

  22. #1172
    I am that guy RandomGuy's Avatar
    My Team
    San Antonio Spurs
    Join Date
    Jun 2005
    Post Count
    50,681
    Seems Yoni is in the mood to give me more material to prove the OP.

    Have at it.
    RandomGuy is offline

  23. #1173
    Veteran Wild Cobra's Avatar
    My Team
    Portland Trailblazers
    Join Date
    May 2007
    Post Count
    43,117
    You know, just a few nights ago, we set again record lows in Oregon. Both in Hood River and Portland.

    Now I get it that the global average is what is said to be rising, but shouldn't we have also seen an end to record lows, especially multiples in a year?

    If greenhouse gasses are the cause of warming, then keep in mind, they work at all temperatures, all seasons, with or without the sun.

    Use a little common sense. We wouldn't have record winter lows at night if the greenhouse effect was the major cause of warming.
    Last edited by Wild Cobra; 02-27-2011 at 01:23 PM.
    Wild Cobra is offline

  24. #1174
    I am that guy RandomGuy's Avatar
    My Team
    San Antonio Spurs
    Join Date
    Jun 2005
    Post Count
    50,681
    You know, just a few nights ago, we set again record lows in Oregon. Both in Hood River and Portland.

    Now I get it that the global average is what is said to be rising, but shouldn't we have also seen an end to record lows, especially multiples in a year?

    If greenhouse gasses are the cause of warming, then keep in mind, they work at all temperatures, all seasons, with or without the sun.

    Use a little common sense. We wouldn't have record winter lows at night if the greenhouse effect was the major cause of warming.
    Once again, the total of the system acts differently than the individual parts.

    If warming in some regions causes weather patterns to shift, then you can indeed get record cold temperatures in areas. If cold arctic air that normally stays in the arctic shifts due to these patterns then you get record cold snaps, as was apparently the case recently.

    I can tell you that central Texas a coupel of years ago spent more days with highs over 100F than in recoreded history.

    We are seeing more extreme weather of all sorts, and seems to be in line with changes we would expect from the additional CO2 that we have pumped into the atmosphere.
    RandomGuy is offline

  25. #1175
    Veteran Wild Cobra's Avatar
    My Team
    Portland Trailblazers
    Join Date
    May 2007
    Post Count
    43,117
    Once again, the total of the system acts differently than the individual parts.

    If warming in some regions causes weather patterns to shift, then you can indeed get record cold temperatures in areas. If cold arctic air that normally stays in the arctic shifts due to these patterns then you get record cold snaps, as was apparently the case recently.

    I can tell you that central Texas a coupel of years ago spent more days with highs over 100F than in recoreded history.

    We are seeing more extreme weather of all sorts, and seems to be in line with changes we would expect from the additional CO2 that we have pumped into the atmosphere.
    LOL...

    Excuses, excuses...

    rationalizing are we?
    Wild Cobra is offline

Thread Information

Users Browsing this Thread

There are currently 4 users browsing this thread. (0 members and 4 guests)

Posting Permissions

  • You may not post new threads
  • You may not post replies
  • You may not post attachments
  • You may not edit your posts
  •