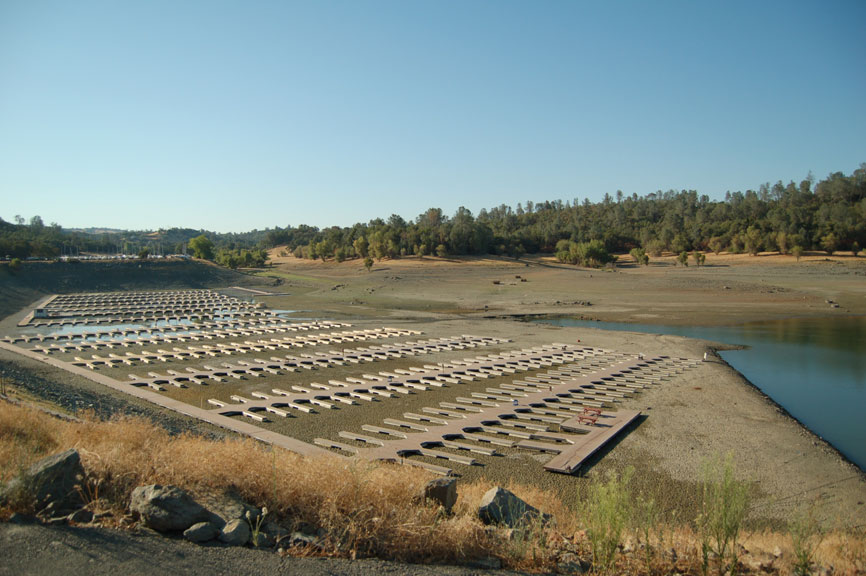
What is so unusual about this?
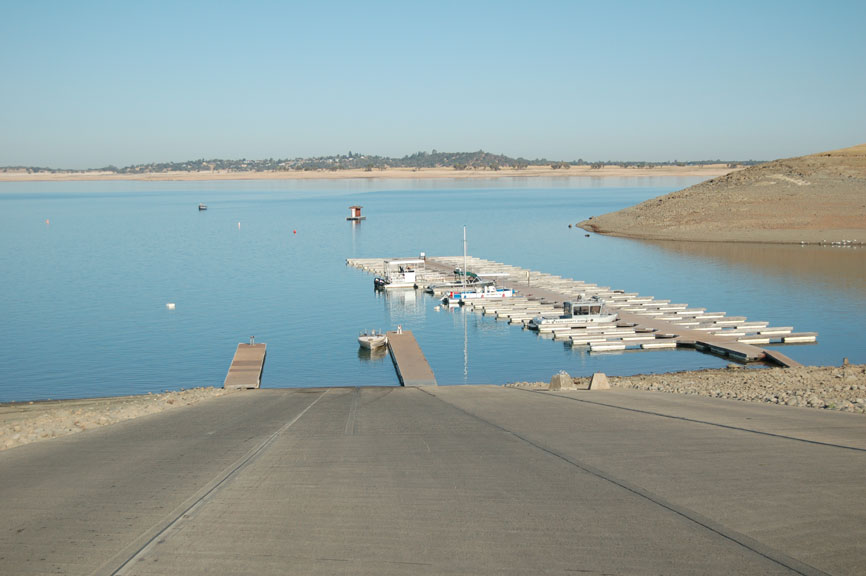
Here are more images:
However, these were taken 8/28/07
This is interesting too:
do you deny there is a draught in CA?
No.
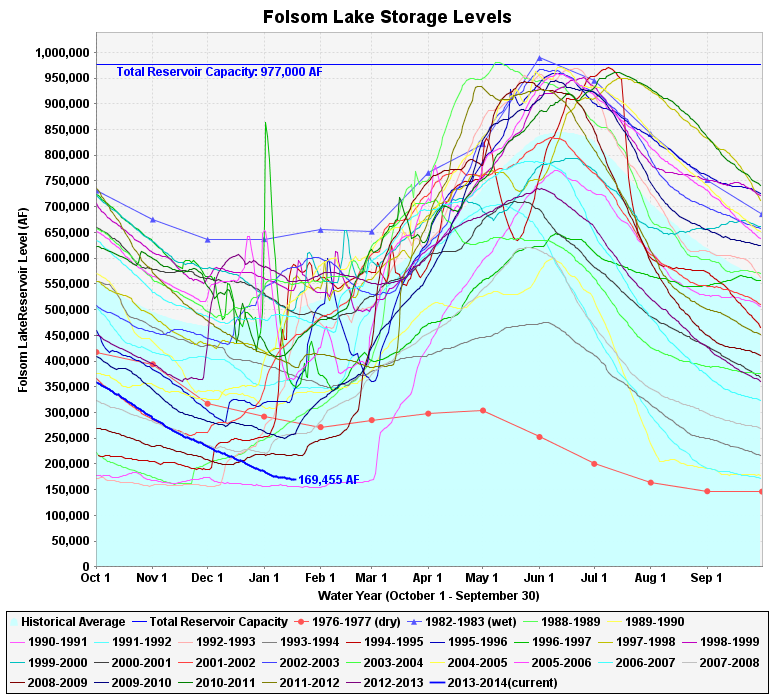
I am only pointing out it isn't unusual. As the population increases more and more, the reservoirs will drain more and more.
Here is another link you might like:
California Reservoirs
Too bad it's records start in 1997: USGS 08179500 Medina Lk nr San Antonio, TX
It's still higher than the 2012 point: Lake Travis Water Level

2 feet higher?
Wow.
2012 was already severe draught in central TX, not a "good" reference date
Precipitation varies Just because it is lower in one geographical area doesn't mean it is everywhere. Here are the two major reservoirs that furnish water to my area:
They don't show the same trend as those your alarmist buddies cherry pick for you to regurgitate. Now we were under a water shortage mandate in 2009, but as you see, both reservoirs got pretty low. The problem was threefold. We had less than normal precipitation in the summer, more rain in Feb/Mar, and warmer temperatures in Jan/Feb reducing the snowpack that normally melts evenly into the summer.
Weather is simply chaotic.
weather, climate instability was predicted 35 years ago due to AGW. prediction was true. the orbital variation should be causing a global cooling period, but AGW is ovecoming it.
LOL...
Climate variability has persisted throughout history without the alarmists view of AGW.
LOL trying to use Medina Lake levels as proof of global warming. It has been a disappointment since it's construction.
typical specious bull from BigCarbon shills, AGW deniers
"Allow me to retort": Warming is natural, "in history" the earth was a ball of lava.
Extreme weather variability due to AGW overcoming orbital-caused cooling is in comparison with the last 100 years, not the life of the planet.
Boutons...
You are a lost cause.

Everyone just keep in mind that WC barely knows how to interpret graphs and check to make sure he didn't make them himself because then you can bet he did something extra stupid.
By all means. Please explain the graphs I posted then.
non-sequitur. me saying that you have shown a track record of ty graphs does not mean I should explain these ones. you do have a ty track record and if someone other than you asks about it then I will answer. I am not wasting my time arguing with you about your idiocy on merit anymore.
I did like how you used geographic locations as the dependent variable and tried to represent it as a linear relationship though. That was pretty damn ignorant.
I see.
Because you don't have the brain power to comprehend a graph... you class them as ty.
Noted...
LOL... I doubt it...
What? My showing that one area wasn't having the same problem as another is ignorant? I think it is your ignorance that doesn't see what i was explaining.
You and I both know that you are considered the village idiot by quite a few people. If not for boutons, then many others would take that tact but he draws the conservative ire. Despite that people like DMC and teysha mock you with regularity and none of the board conservatives come to back you up. Quite the contrary as time and again they distance themselves from you.
I am speaking to your credibility. You have none and me stating that it's not worth the bother of figuring out if you ed up yet another graph has nothing to do with my a en. I just have read enough of your tripe to know it to be the case.
You used a linear model to describe a geographic trend. You were more than trying to show that they were 'different.' You were trying to show a linear progression and a correlation regarding race racial demographics. You failed horribly. That's why.
Wow...
If I have no credibility, then you must have nothing at all.
I pity you. Having to slam me because you cannot explain what's wrong with what I said vs. the graphs. I wasn't modelling anything here. Just what was I modeling?
Ah the "I know you are but what am I ' rebuttal.
How about explaining how I am wrong about the water levels?
There are currently 1 users browsing this thread. (0 members and 1 guests)
 Posting Permissions


 Reply With Quote