Page 1 of 2 12 LastLast
Results 1 to 25 of 38
  1. #1
    dangerous floater Winehole23's Avatar
    My Team
    San Antonio Spurs
    Join Date
    Nov 2008
    Post Count
    113,951
    Federal Reserve, declaring that the economy would need help for years to come, said Wednesday it would extend by 18 months the period that it plans to hold down interest rates in an effort to spur growth. The Fed said that it now planned to keep short-term interest rates near zero until late 2014, continuing the transformation of a policy that began as shock therapy in the winter of 2008 into a six-year campaign to increase spending by rewarding borrowers and punishing savers.
    http://www.nytimes.com/2012/01/26/bu...2014.html?_r=1

  2. #2
    dangerous floater Winehole23's Avatar
    My Team
    San Antonio Spurs
    Join Date
    Nov 2008
    Post Count
    113,951
    Two policy makers -- no names were attached to the forecasts -- expect the funds rate to first begin rising in 2016. (My money is on New York Fed President Bill Dudley and Governor Janet Yellen.) That would mean eight years of 0 percent interest rates.
    http://www.bloomberg.com/news/2012-0...line-baum.html

  3. #3
    Mr. John Wayne CosmicCowboy's Avatar
    My Team
    San Antonio Spurs
    Join Date
    Mar 2003
    Post Count
    44,136
    Interesting. It's really distorting the market when interest rates are artificially held below the inflation rate. I've been waiting for a bottom in the market to refinance my house and am about to pull the trigger. I just don't see long term rates going any lower. I was gonna do 15 years but I'm now seriously considering doing a 30 year cash out...When I can borrow at 4% and deduct the interest that puts my effective rate at about 3%. I've got a lot of equity and may go ahead and pull the difference out and running it back up to 80% d/e ratio. It might look like a brilliant thing to do in 10 years if interest/inflation rates go back to traditional values or even higher because of the fed trashing the dollar.

  4. #4
    dangerous floater Winehole23's Avatar
    My Team
    San Antonio Spurs
    Join Date
    Nov 2008
    Post Count
    113,951
    Bill Gross weighs in on zero bound interest rates.

    Bottom line, it kills savings and depresses economies.

    So the Fed has chosen to hold off on their goal of normalizing interest rates and the ECB has countered with the threat of extending their scheduled QE with more checks and more negative interest rates and the investment community wonders how long can this keep goin’ on. For a long time I suppose, as evidenced by history at least. Ken Rogoff and Carmen Reinhart have meticulously do ented periods of “financial repression”, long stretches of years and in some cases decades where short-term and even long-term yields were capped and suppressed below the level of inflation. In the U.S. the most recent repressive cycle extended from 1930 to 1979, nearly half a century during which investors on average earned 1.5% less than the rate their principal was eroding due to inflation. It was a savers nightmare.

    But then Paul Volcker turned the bond market upside down and ever since (until 2009), financial markets enjoyed positive real yields and a kick in the pants boost to other asset prices, as those yields gradually came down and increased the present value of bonds, stocks and real estate. Low or zero interest rates it seems do wonders for asset prices and for a time even stabilize real economies, but they come with baggage and as zero or near zero becomes the expected norm, the luggage increasingly grows heavier. Model driven central banks seem not to notice. Accustomed to Taylor Rules and Phillips Curves, their commentary is almost obsessively focused on employment statistics and their ultimate impact on inflation. Lost in translation however, or perhaps lost in transition to a New Normal financial economy, is the fact that while 0% or .25% or other countries’ financially suppressed yields might be appropriate for keeping their economy’s head above water, they act as a weight or an economic “sinker” that ultimately lowers economic growth as well.


    No Model will lead to this conclusion. Only the Japanese experience of the last several decades seems to give a hint, but the aging demographics of their society is offered as a convenient excuse for their experience. Zero is never mentioned as a complicit accomplice, especially since inflation itself has averaged much the same. But models aside, there should be space in an economic textbook or the minutes of a central bank meeting to acknowledge the destructive influence of 0% interest rates over the intermediate and longer term.


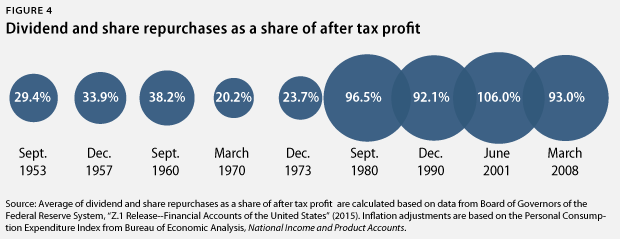
    How so? Because zero bound interest rates destroy the savings function of capitalism, which is a necessary and in fact synchronous component of investment. Why that is true is not immediately apparent. If companies can borrow close to zero, why wouldn’t they invest the proceeds in the real economy? The evidence of recent years is that they have not. Instead they have plowed trillions into the financial economy as they buy back their own stock with a seemingly safe tax advantaged arbitrage. But more importantly, zero destroys existing business models such as life insurance company balance sheets and pension funds, which in turn are expected to use the proceeds to pay benefits for an aging boomer society. These assumed liabilities were based on the assumption that a balanced portfolio of stocks and bonds would return 7-8% over the long term. Now with corporate bonds at 2-3%, it is obvious that to pay for future health, retirement and insurance related benefits, stocks must appreciate by 10% a year to meet the targeted assumption. That, of course, is a stretch of some accountant’s or actuary’s imagination.


    Do central bankers not observe that Detroit, Puerto Rico, and soon Chicago, Illinois cannot meet their promised liabilities? Do they simply chalk it up to bad management and inept governance and then return to their Phillips Curves for policy guidance? Do they not know that if zero were to become the long-term norm, that any economic participant that couldn’t print its own money (like they can), would soon “run on empty” as Blackstone’s Pete Peterson once expressed it in describing our likely future scenario? The developed world is beginning to run on empty because investments discounted at near zero over the intermediate future cannot provide cash flow or necessary capital gains to pay for past promises in an aging society. And don’t think that those poor insurance companies and gargantuan pension funds in the hundreds of billions are the only losers. Mainstream America with their 401Ks are in a similar pickle. Expecting 8-10% to pay for education, healthcare, retirement or simply taking an accustomed vacation, they won’t be doing much of it as long as short term yields are at zero. They are not so much in a pickle barrel as they are on a revolving spit, being slowly cooked alive while central bankers focus on their Taylor models and fight non-existent inflation.
    https://www.janus.com/bill-gross-investment-outlook

  5. #5
    Independent DMX7's Avatar
    My Team
    San Antonio Spurs
    Join Date
    Jun 2008
    Post Count
    22,149
    I have to think it's inflating the stock market too. I can't keep much money in an online savings account earning 1%... I basically am forced to use some stable blue-chip dividend paying stocks as my de facto savings account to earn a decent return.

  6. #6
    Veteran
    My Team
    San Antonio Spurs
    Join Date
    Mar 2009
    Post Count
    97,536
    "I have to think it's inflating the stock market too"

    of course, if bonds aren't paying anything, then go gambling in the stock market, private banking, predatory lending, etc.

  7. #7
    Veteran
    My Team
    San Antonio Spurs
    Join Date
    Mar 2009
    Post Count
    97,536
    0 rates mean they want u ers to spend on u dont need...

    why not buy more properties and rent it out since house and rates are dirt cheap in america, whattabout rent yields? any good?
    100Ks are homeless in USA because they can't make any rent. predatory capitalists have purchased Ms of homes to rent them out, and in "hot cities" like SFO, NYC, Brooklyn, the rents are extremely high, forcing out all the upper middle class and above.

    Parents moving in with their kids, adults living together to split the rent, etc, etc. Bug Jamie Dimon just said this week that everything is so much better than a couple decades ago (for him).

  8. #8
    Independent DMX7's Avatar
    My Team
    San Antonio Spurs
    Join Date
    Jun 2008
    Post Count
    22,149
    They should have raised it at least 25 basis points... they probably will this year.

  9. #9
    Veteran
    My Team
    San Antonio Spurs
    Join Date
    Mar 2009
    Post Count
    97,536
    How the Los Angeles' homeless crisis got so bad

    http://www.latimes.com/local/lanow/la-me-ln-how-los-angeles-homeless-crisis-got-so-bad-20150922-story.html

  10. #10
    Veteran
    My Team
    San Antonio Spurs
    Join Date
    Mar 2009
    Post Count
    97,536
    Brooklyn Worst in U.S. for Home Affordability


    http://www.bloomberg.com/news/articl...-affordability

  11. #11
    Veteran
    My Team
    San Antonio Spurs
    Join Date
    Mar 2009
    Post Count
    97,536
    Wolf Richter: This is When Bonds Go Kaboom!

    It’s getting tougher out there for our QE and ZIRP-coddled corporate junk-bond heroes.

    In the energy sector, the bond devastation is even worse.

    California Resources – Occidental Petroleum’s spinoff of its oil-and-gas assets in California, a masterpiece of Wall Street engineering – has done nothing but burn investors in its 10 months as an independent company. When I last wrote about it ten days ago, its $2.25 billion of 6% notes due 2024, issued at par to QE-drunk investors in September last year, had plunged to 66 cents on the dollar. Now they’re at 59.5 cents on the dollar [read… A Spinoff Goes to Heck, after Just 10 Months].


    Chesapeake Energy, the second largest natural gas driller in the US, is also facing the music. Two of its brethren, Quicksilver Resources and Samson Resources, have already filed for bankruptcy. When I last wrote about Chesapeake a month ago, its $1.1 billion of 5.75% notes due 2023 – that in June 2014 had been at 112 cents on the dollar – had plummeted to 70. Now they’re at 67 [read… Whose Capital Is Getting Destroyed in US Natural Gas?].


    Oil and gas producer Halcon Resources, which has been demolishing its investors via serial debt exchanges that are becoming the model for distressed companies, saw its 8.875% notes due 2021 drop to 33.5 cents on the dollar. And darling Linn Energy saw its 6.5% notes due 2021 collapse to 23 cents on the dollar.


    They’re in the toxic miasma of “distressed debt,” bonds that are deemed to be in so much trouble that their yields have soared to where the spread between their yields and the yield of US Treasuries has hit or surpassed 10 percentage points.


    Standard & Poor’s, which tracks the “distress ratio” it its Distressed Debt Monitor, announced on September 24, that the distress ratio, after rising since late last year, hit 15.7%, the worst level since December 2011.


    Oil and gas accounted for 95 of the 270 bonds in that elite club and sported the second-worst sector distress ratio of 41.9%. The metals, mining, and steel sector, with 47 bonds in the club, had the worst sector distress ratio of 53.4%. Rising distress levels are a leading indicator for defaults. And defaults have already been creeping up.


    This chart from LCD HY Weekly shows the distress ratio of leveraged loans as measured by S&P Capital IQ LCD (blue line) and of junk bonds as measured by BofA Merrill Lynch (red line) which depicts reality in an even harsher light than Standard and Poor’s. Leveraged loans are generally secured and hold up better in a bankruptcy than bonds. But distress levels of both have recently begun to e:


    These yields that are rising to distressed levels drive up the spread between corporate bond yields and US Treasury yields. The spread is a measure of perceived risk. It had dropped to ludicrously low levels. This wasn’t a function of risk somehow disappearing from Planet Earth. It was a function of the Fed’s beating investors into submission with its zero-interest-rate policy so that they would eliminate risk as a factor being priced into their calculus. Now risk is re-inserting itself into the calculus. And look what happened.

    Investors are suddenly discovering an idea – the very one the Fed in its infinite wisdom has beaten out them: they want to be compensated at least a tiny bit for taking on huge risks. And now spreads have begun tentative efforts to e, “tentative” because history shows that they can blow through the roof:


    http://www.nakedcapitalism.com/2015/...+capitalism%29


  12. #12
    dangerous floater Winehole23's Avatar
    My Team
    San Antonio Spurs
    Join Date
    Nov 2008
    Post Count
    113,951
    IMF puts its thumb on the scales:

    The International Monetary Fund (IMF) has issued a double warning over higher US interest rates, which it said could trigger a wave of emerging market corporate defaults and panic in financial markets as liquidity evaporates.


    The IMF said corporate debts in emerging markets ballooned to $18 trillion (£12 trillion) last year, from $4 trillion in 2004 as companies gorged themselves on cheap debt.


    It said the quadrupling in debt had been accompanied by weaker balance sheets, making companies more vulnerable to US rate rises.


    "As advanced economies normalise monetary policy, emerging markets should prepare for an increase in corporate failures," the IMF said in a pre-released chapter of its latest Financial Stability Report.
    http://www.telegraph.co.uk/finance/e...warns-IMF.html

  13. #13
    Veteran
    My Team
    San Antonio Spurs
    Join Date
    Mar 2009
    Post Count
    97,536
    Raising the interest rates will help capitalists playing the bonds market, but

    Census Department to America: Things Aren’t Getting Better

    We’re in trouble now.

    That’s the underlying message of a new Census Department report on income and poverty.

    The overall picture is bleak and discouraging: Namely, things haven’t changed. Women still make less than men: The median earnings for women who worked full time, year-round were $39,621 – 79 percent of men’s, at $50,383, for the same group.


    There has not been a statistically significant annual increase in this figure since 2007 — before the Great Recession.


    Before the recession, in spring 2007, 19.7 million people lived in households with that definition. Eight years later though, that number has increased by 4.2 million, almost 20 percent of all households. Out of that 23.9 million, 15.1 percent of them were between the ages of 25 and 34. The report pointed out that shared households often arise out of monetary need; it’s estimated that for those 6.5 million young adults, 39.4 percent would be considered to be living under the poverty threshold for a single person.


    In other words, nearly 40 percent of adults in their mid-20s to their mid30s live with their parents or other relatives because they are too poor not to. Many of these are people who graduated college before the recession.


    http://www.nationalmemo.com/census-d...etting-better/


  14. #14
    Veteran
    My Team
    San Antonio Spurs
    Join Date
    Mar 2009
    Post Count
    97,536
    Economic Snapshot: September 2015

    1. Economic growth, while positive, has been uneven and lackluster for years.

    Gross domestic product, or GDP, increased in the second quarter of 2015 at an inflation-adjusted annual rate of 3.9 percent, after an increase of 0.6 percent in the previous quarter. The economy has expanded at an average annual rate of 2.2 percent since the recession ended in June 2009. This is far below the historical average growth rate of 3.4 percent from December 1948—when the first recession after World War II started—to December 2007, when the last recession started. Personal consumption increased at an annual rate of 3.6 percent, and spending on housing rose 9.3 percent—a rather modest rate, considering that the housing market still has a lot of catching up to do. Business investment, on the other hand, increased 4.1 percent, highlighting one of the economy’s persistent weak spots. Exports increased a reasonable 5.1 percent in the second quarter of 2015, and imports grew as well, at a rate of 3 percent. Government spending—which is crucial for infrastructure spending on roads, bridges, and schools, as well as for public services, such as education, public safety, and transportation—continues to be another weak spot in the economy. Federal government spending held steady in the second quarter, and state and local government spending increased a modest 4.3 percent. The economy needs to maintain and even accelerate its momentum in order to create real economic security for America’s families, especially in light of increasing headwinds, most notably economic weaknesses overseas, that could result in weaker exports in the future.


    2. U.S. compe iveness is increasing very slowly.

    Productivity growth, measured as the increase in inflation-adjusted output per hour, is key to strong economic growth over the longer term and to increasing living standards for American families because it means that workers are getting better at doing more in the same amount of time. Slower productivity growth thus means that new economic resources available to improve living standards and to pay for a wide range of services, such as the retirement of Baby Boomers, are growing more slowly than would be the case with faster productivity growth. U.S. productivity rose a total of 5.9 percent from June 2009, the end of the Great Recession, to June 2015. This is an average annualized quarterly growth rate of 1.0 percent in annual terms, far below the quarterly average of 2.2 percent from December 1948—when the first recession after World War II started—to December 2007, when the last recession started. This slow productivity growth—together with high income inequality—contributes to the widespread sense of economic insecurity and slowing economic mobility because the economic resources for families to get ahead are increasing slowly and are very unequally distributed.


    3. The housing market still operates at a low level.

    New-home sales amounted to an annual rate of 552,000 in August 2015—a 21.6 percent increase from the 454,000 homes sold in August 2014 but well below the historical average of 698,000 homes sold before the Great Recession. The median new-home price in August 2015 was $292,700, up from one year earlier. Existing-home sales fell 4.8 percent in August 2015 from one year earlier, and the median price for existing homes was up 4.7 percent during the same period. Home sales have a lot further to go, given that homeownership in the United States stood at 63.4 percent in the second quarter of 2015, down from 68.2 percent before the start of the recession at the end of 2007. The current homeownership rates are similar to those recorded in 1996, well before the most recent housing bubble started. A strong housing market recovery can boost economic growth and household economic security, and there is still plenty of room for the housing market to provide more stimulation to the economy more broadly.


    4. The outlook for federal budgets improves, which creates breathing room for policymakers.

    The nonpartisan Congressional Budget Office, or CBO, estimated in August 2015 that the federal government will have a deficit—the difference between taxes and spending—of 2.4 percent of GDP for fiscal year 2015, which runs from October 1, 2014, to September 30, 2015. This deficit projection is slightly down from the deficit of 2.8 percent of GDP for FY 2014. The estimated deficit for FY 2015 is much smaller than deficits in previous years due to a number of measures that policymakers have already taken in order to slow spending growth and raise more revenue than was expected just last year. The improving fiscal outlook should generate breathing room for policymakers to focus their attention on targeted, efficient policies that promote long-term growth and job creation, especially for those groups disproportionately impacted by high unemployment.


    5. Moderate labor market gains follow in part from weak public-sector growth.

    There were 11.3 million more jobs in August 2015 than in June 2009. The private sector added 11.9 million jobs during this period. The loss of some 505,000 state and local government jobs explains the difference between the net gain of all jobs and the private-sector gain in this period. Budget cuts reduced the number of teachers, bus drivers, firefighters, and police officers, among others. The average monthly annualized employment growth rate from June 2009 to August 2015 was just 1.4 percent, well below the long-run average of 1.9 percent from December 1948—when the first recession after World War II started—to December 2007, when the last recession started. Faster economic growth and an end to ill-advised austerity are necessary to generate more labor market momentum and more well-paying jobs for American families.


    6. Some communities continue to struggle disproportionately from unemployment.

    The unemployment rate was 5.1 percent in August 2015. The African American unemployment rate increased to 9.5 percent, the Hispanic unemployment rate decreased to 6.6 percent, and the white unemployment rate fell to 4.4 percent. Meanwhile, youth unemployment increased to 16.9 percent. The unemployment rate for people without a high school diploma decreased to 7.7 percent, compared with 5.5 percent for those with a high school degree, 4.4 percent for those with some college education, and 2.5 percent for those with a college degree. Amid the weak labor market, population groups with higher unemployment rates have struggled disproportionately more than white workers, older workers, and workers with more education.


    7. The rich continue to pull away from most Americans.

    Incomes of households at the 95th percentile—those with incomes of $206,568 in 2014, the most recent year for which data are available—were more than nine times the incomes of households in the 20th percentile, whose incomes were $21,432. Analysis by the U.S. Bureau of the Census shows that income inequality remains at or near a record level: In 2014,the top 5 percent of earners captured 21.8 percent of total income, whereas the bottom 40 percent of earners captured 12.3 percent of total income.


    8. Corporate profits stay elevated near pre-crisis peaks.

    Inflation-adjusted corporate profits were 105.8 percent larger in June 2015 than in June 2009. The after-tax corporate profit rate—profits to total assets—stood at 3.05 percent in June 2015. Corporate profits recovered quickly toward the end of the Great Recession and have stayed high since then. These gains have translated into disproportionate income gains from financial investments for wealthy households, contributing to the massive income inequality that has characterized the economy for the past few decades. Tax reform is a crucial policy priority to address income inequality that arises from the rich receiving outsized benefits from their wealth, especially in the form of capital income from their financial investments.


    9. Corporations spend much of their money to keep shareholders happy.

    From December 2007—when the Great Recession started—to June 2015, nonfinancial corporations spent, on average, 93 percent of their after-tax profits on dividend payouts and share repurchases. In short, almost all of nonfinancial corporate after-tax profits have gone to keeping shareholders happy during the current business cycle. Nonfinancial corporations also held, on average, 5.3 percent of all of their assets in cash—a very high rate by historical standards. Nonfinancial corporations spent, on average, 168.3 percent of their after-tax profits on capital expenditures or investments—by selling other assets and by borrowing. This was the lowest ratio since the business cycle that ended in 1957. U.S. corporations have prioritized keeping shareholders happy and building up cash over investments in structures and equipment, highlighting the need for regulatory reform that incentivizes corporations to invest in research and development, manufacturing plants and equipment, and workforce development.


    10. Poverty is still widespread.

    The official poverty rate was 14.8 percent in 2014. This change, however, was statistically insignificant from 2013. Some population groups suffer from much higher poverty rates than others. The African American poverty rate, for instance, was 25.2 percent, and the Hispanic poverty rate was 24.7 percent, while the non-Hispanic white poverty rate was 10 percent. The poverty rate for children under age 18 was 21.5 percent. More than one-third of African American children—37.1 percent—lived in poverty in 2014, compared with 31.9 percent of Hispanic children and 12.3 percent of white children.


    11. Household debt is still high.

    Household debt equaled 107.4 percent of after-tax income in March 2015, down from a peak of 129.7 percent in December 2007. But nonrevolving consumer credit—typically installment credit such as student and car loans—has outpaced after-tax income growth. It has grown from 14.6 percent of after-tax income in June 2009 to 18.7 percent in June 2015. This is the highest share of such debt to after-tax income on record, dating back to 1968. A return to debt growth outpacing income growth—which was the case for total debt prior to the start of the Great Recession—from already-high debt levels could eventually slow economic growth again, as people would have to focus on repaying loans and financial instability would take its toll. This would be especially true if interest rates also rise from historically low levels due to a change in the Federal Reserve’s policies. Consumers would have to pay more for their debt, and they would have less money available for consumption and saving, slowing economic growth and job creation.


    https://www.americanprogress.org/iss...eptember-2015/


  15. #15
    Veteran
    My Team
    San Antonio Spurs
    Join Date
    May 2008
    Post Count
    20,699
    Economic Snapshot: September 2015

    1. Economic growth, while positive, has been uneven and lackluster for years.

    Gross domestic product, or GDP, increased in the second quarter of 2015 at an inflation-adjusted annual rate of 3.9 percent, after an increase of 0.6 percent in the previous quarter. The economy has expanded at an average annual rate of 2.2 percent since the recession ended in June 2009. This is far below the historical average growth rate of 3.4 percent from December 1948—when the first recession after World War II started—to December 2007, when the last recession started. Personal consumption increased at an annual rate of 3.6 percent, and spending on housing rose 9.3 percent—a rather modest rate, considering that the housing market still has a lot of catching up to do. Business investment, on the other hand, increased 4.1 percent, highlighting one of the economy’s persistent weak spots. Exports increased a reasonable 5.1 percent in the second quarter of 2015, and imports grew as well, at a rate of 3 percent. Government spending—which is crucial for infrastructure spending on roads, bridges, and schools, as well as for public services, such as education, public safety, and transportation—continues to be another weak spot in the economy. Federal government spending held steady in the second quarter, and state and local government spending increased a modest 4.3 percent. The economy needs to maintain and even accelerate its momentum in order to create real economic security for America’s families, especially in light of increasing headwinds, most notably economic weaknesses overseas, that could result in weaker exports in the future.


    2. U.S. compe iveness is increasing very slowly.

    Productivity growth, measured as the increase in inflation-adjusted output per hour, is key to strong economic growth over the longer term and to increasing living standards for American families because it means that workers are getting better at doing more in the same amount of time. Slower productivity growth thus means that new economic resources available to improve living standards and to pay for a wide range of services, such as the retirement of Baby Boomers, are growing more slowly than would be the case with faster productivity growth. U.S. productivity rose a total of 5.9 percent from June 2009, the end of the Great Recession, to June 2015. This is an average annualized quarterly growth rate of 1.0 percent in annual terms, far below the quarterly average of 2.2 percent from December 1948—when the first recession after World War II started—to December 2007, when the last recession started. This slow productivity growth—together with high income inequality—contributes to the widespread sense of economic insecurity and slowing economic mobility because the economic resources for families to get ahead are increasing slowly and are very unequally distributed.


    3. The housing market still operates at a low level.

    New-home sales amounted to an annual rate of 552,000 in August 2015—a 21.6 percent increase from the 454,000 homes sold in August 2014 but well below the historical average of 698,000 homes sold before the Great Recession. The median new-home price in August 2015 was $292,700, up from one year earlier. Existing-home sales fell 4.8 percent in August 2015 from one year earlier, and the median price for existing homes was up 4.7 percent during the same period. Home sales have a lot further to go, given that homeownership in the United States stood at 63.4 percent in the second quarter of 2015, down from 68.2 percent before the start of the recession at the end of 2007. The current homeownership rates are similar to those recorded in 1996, well before the most recent housing bubble started. A strong housing market recovery can boost economic growth and household economic security, and there is still plenty of room for the housing market to provide more stimulation to the economy more broadly.


    4. The outlook for federal budgets improves, which creates breathing room for policymakers.

    The nonpartisan Congressional Budget Office, or CBO, estimated in August 2015 that the federal government will have a deficit—the difference between taxes and spending—of 2.4 percent of GDP for fiscal year 2015, which runs from October 1, 2014, to September 30, 2015. This deficit projection is slightly down from the deficit of 2.8 percent of GDP for FY 2014. The estimated deficit for FY 2015 is much smaller than deficits in previous years due to a number of measures that policymakers have already taken in order to slow spending growth and raise more revenue than was expected just last year. The improving fiscal outlook should generate breathing room for policymakers to focus their attention on targeted, efficient policies that promote long-term growth and job creation, especially for those groups disproportionately impacted by high unemployment.


    5. Moderate labor market gains follow in part from weak public-sector growth.

    There were 11.3 million more jobs in August 2015 than in June 2009. The private sector added 11.9 million jobs during this period. The loss of some 505,000 state and local government jobs explains the difference between the net gain of all jobs and the private-sector gain in this period. Budget cuts reduced the number of teachers, bus drivers, firefighters, and police officers, among others. The average monthly annualized employment growth rate from June 2009 to August 2015 was just 1.4 percent, well below the long-run average of 1.9 percent from December 1948—when the first recession after World War II started—to December 2007, when the last recession started. Faster economic growth and an end to ill-advised austerity are necessary to generate more labor market momentum and more well-paying jobs for American families.


    6. Some communities continue to struggle disproportionately from unemployment.

    The unemployment rate was 5.1 percent in August 2015. The African American unemployment rate increased to 9.5 percent, the Hispanic unemployment rate decreased to 6.6 percent, and the white unemployment rate fell to 4.4 percent. Meanwhile, youth unemployment increased to 16.9 percent. The unemployment rate for people without a high school diploma decreased to 7.7 percent, compared with 5.5 percent for those with a high school degree, 4.4 percent for those with some college education, and 2.5 percent for those with a college degree. Amid the weak labor market, population groups with higher unemployment rates have struggled disproportionately more than white workers, older workers, and workers with more education.


    7. The rich continue to pull away from most Americans.

    Incomes of households at the 95th percentile—those with incomes of $206,568 in 2014, the most recent year for which data are available—were more than nine times the incomes of households in the 20th percentile, whose incomes were $21,432. Analysis by the U.S. Bureau of the Census shows that income inequality remains at or near a record level: In 2014,the top 5 percent of earners captured 21.8 percent of total income, whereas the bottom 40 percent of earners captured 12.3 percent of total income.


    8. Corporate profits stay elevated near pre-crisis peaks.

    Inflation-adjusted corporate profits were 105.8 percent larger in June 2015 than in June 2009. The after-tax corporate profit rate—profits to total assets—stood at 3.05 percent in June 2015. Corporate profits recovered quickly toward the end of the Great Recession and have stayed high since then. These gains have translated into disproportionate income gains from financial investments for wealthy households, contributing to the massive income inequality that has characterized the economy for the past few decades. Tax reform is a crucial policy priority to address income inequality that arises from the rich receiving outsized benefits from their wealth, especially in the form of capital income from their financial investments.


    9. Corporations spend much of their money to keep shareholders happy.

    From December 2007—when the Great Recession started—to June 2015, nonfinancial corporations spent, on average, 93 percent of their after-tax profits on dividend payouts and share repurchases. In short, almost all of nonfinancial corporate after-tax profits have gone to keeping shareholders happy during the current business cycle. Nonfinancial corporations also held, on average, 5.3 percent of all of their assets in cash—a very high rate by historical standards. Nonfinancial corporations spent, on average, 168.3 percent of their after-tax profits on capital expenditures or investments—by selling other assets and by borrowing. This was the lowest ratio since the business cycle that ended in 1957. U.S. corporations have prioritized keeping shareholders happy and building up cash over investments in structures and equipment, highlighting the need for regulatory reform that incentivizes corporations to invest in research and development, manufacturing plants and equipment, and workforce development.


    10. Poverty is still widespread.

    The official poverty rate was 14.8 percent in 2014. This change, however, was statistically insignificant from 2013. Some population groups suffer from much higher poverty rates than others. The African American poverty rate, for instance, was 25.2 percent, and the Hispanic poverty rate was 24.7 percent, while the non-Hispanic white poverty rate was 10 percent. The poverty rate for children under age 18 was 21.5 percent. More than one-third of African American children—37.1 percent—lived in poverty in 2014, compared with 31.9 percent of Hispanic children and 12.3 percent of white children.


    11. Household debt is still high.

    Household debt equaled 107.4 percent of after-tax income in March 2015, down from a peak of 129.7 percent in December 2007. But nonrevolving consumer credit—typically installment credit such as student and car loans—has outpaced after-tax income growth. It has grown from 14.6 percent of after-tax income in June 2009 to 18.7 percent in June 2015. This is the highest share of such debt to after-tax income on record, dating back to 1968. A return to debt growth outpacing income growth—which was the case for total debt prior to the start of the Great Recession—from already-high debt levels could eventually slow economic growth again, as people would have to focus on repaying loans and financial instability would take its toll. This would be especially true if interest rates also rise from historically low levels due to a change in the Federal Reserve’s policies. Consumers would have to pay more for their debt, and they would have less money available for consumption and saving, slowing economic growth and job creation.


    https://www.americanprogress.org/iss...eptember-2015/


    If only we could find a President who would promise Hope and Change.

  16. #16
    Veteran
    My Team
    San Antonio Spurs
    Join Date
    Mar 2009
    Post Count
    97,536
    If only we could find a President who would promise Hope and Change.
    The Repugs don't want change. The intend to keep the game rigged for the BigCorp and 1%.

  17. #17
    Veteran Th'Pusher's Avatar
    My Team
    San Antonio Spurs
    Join Date
    Feb 2010
    Post Count
    6,130
    $206K household income gets you into the top 5%? That seems low.

  18. #18
    Veteran
    My Team
    San Antonio Spurs
    Join Date
    Mar 2009
    Post Count
    97,536
    $206K household income gets you into the top 5%? That seems low.
    http://www.nytimes.com/interactive/2...rcent-map.html

  19. #19
    Veteran
    My Team
    San Antonio Spurs
    Join Date
    Mar 2009
    Post Count
    97,536
    ...

  20. #20
    I play pretty, no? TeyshaBlue's Avatar
    My Team
    Dallas Mavericks
    Join Date
    Jun 2006
    Post Count
    13,321
    $206K household income gets you into the top 5%? That seems low.
    It's based on 2012 Census data, so there's a fair amount of slop in that number.

  21. #21
    Veteran
    My Team
    San Antonio Spurs
    Join Date
    Mar 2009
    Post Count
    97,536
    It's based on 2012 Census data, so there's a fair amount of slop in that number.
    slop in which direction?

  22. #22
    I play pretty, no? TeyshaBlue's Avatar
    My Team
    Dallas Mavericks
    Join Date
    Jun 2006
    Post Count
    13,321
    Either way....it's slop (self-selecting data points). Gut tells me the figure is a little low.

  23. #23
    W4A1 143 43CK? Nbadan's Avatar
    My Team
    San Antonio Spurs
    Join Date
    Nov 2001
    Post Count
    32,408
    If only we could find a President who would promise Hope and Change.
    Not trump....that's for damn sure..

  24. #24
    Veteran
    My Team
    San Antonio Spurs
    Join Date
    Mar 2009
    Post Count
    97,536
    Federal Reserve says no more bailouts

    http://www.rawstory.com/2015/11/fede...e+Raw+Story%29


    G M A F B

  25. #25
    Veteran hater's Avatar
    My Team
    San Antonio Spurs
    Join Date
    Feb 2007
    Post Count
    74,105
    The fact that they are terrified to raise the interest even 1/4 of a % should be worrying.

Thread Information

Users Browsing this Thread

There are currently 1 users browsing this thread. (0 members and 1 guests)

Posting Permissions

  • You may not post new threads
  • You may not post replies
  • You may not post attachments
  • You may not edit your posts
  •