
 Reply With Quote
Trying to find solar forcing the way you did is like trying to find an accurate temperature using a stick of butter's hardness.

Agloco, I'd like your opinion on something. You seem to be one of the few people in this sports forum that understands science.
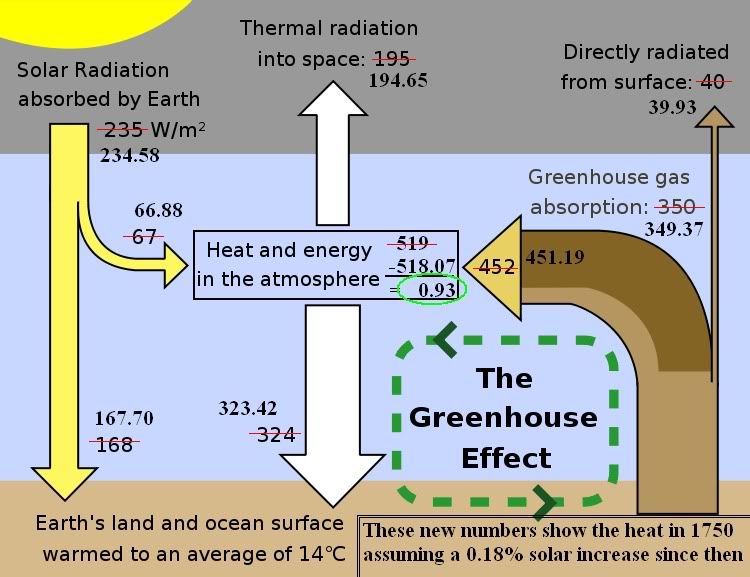
Some time back, I made a simple addition to an early NASA/GISS drawing that illustrates the Greenhouse Effect in a simplistic way. I took the average 0.18% increase in solar radiation from the Maunder Minima to our recent timeframe using the data from the Lean 2004 study. Other studies have larger changes, others less. I picked this particular study because the data is available to the public, and is about midway between others. My 0.18% calculated came from putting the data in Excel, and using a 11 year rolling average. I went from there and changed added what the radiative power would have been and added them to the graph.
I'm going to use the term watts. When I do, know I am simplifying and what I am indicating is watts per square meter.
The IPCC AR4 report uses 0.12 watts for solar radiative forcing changes since 1750. They actually call it direct forcing in one place, but don't dwell much on it. My 0.18% does show a change of 0.12 watts of direct forcing. However, the total change in solar heat is more. There is also an increase of 0.3 watts that makes it to the ground, as the driving heat for the greenhouse effect. When done, I calculate a total increase of radiative forcing of 0.93 watts. Not just 0.12 watts.
Two or three points since the AR4, the IPCC has admitted radiative forcing increases are greater than previously thought. Their revised number is in the neighborhood 0f 0.4 watts, from 0.1 watts. These combined are 1.11 greater that the values assessed in the AR4. The way temperature vs. radiative forcing is understood, this means they have to reduce some other factor. They give CO2 an increased forcing of 1.66 watts. This fits what I understand of CO2 forcing, reducing it to about 0.55 watts.
If you agree or not with my entire rational of the above, do you at least agree the forcing for solar changes are greater than stated by the IPCC? If you see any problems with my simple rational, please explain. The way I see it, they are taking the feedback from the increased solar irradiance, and assigning it to greenhouse gasses, where it doesn't belong.
I think I left the excel file on a different computer, I can find the Lean 2004 data again and do the work again if necessary. This is from a different study, but my graph with the 0.18% increase looks very similar:

Last edited by Wild Cobra; 08-13-2011 at 11:01 AM.

Trying to find solar forcing the way you did is like trying to find an accurate temperature using a stick of butter's hardness.

Here's what you need to do, WC. Use your new forcing figures, calculate them for the past century (as opposed to one figure for a broad span of 250 years) and then using what you come up with and your theorized forcing values for CO2 compare your results to the actual temp record.
What do you come up with?
I don't need your comments from the peanut gallery. It is accepted in the scientific community that there are pretty significant solar changes since 1750 and that is the starting point the IPCC uses.
Bug off if you have nothing useful to interject.
Asking you to compare your figures to the actual temperature record is not useful?I guess your understanding of science doesn't require it work with reality. My bad. Carry on.

I'll accept your position on this, Manny and rescind my statement with the sole caveat that within the context of aeons of climate change, 150 years appeared, to me, to be statstically insignificant.
There are climate variations and discernible patterns that occur over the course of hundreds of years, thousands of years, or weeks. The most widely discussed climate variation is ENSO (El Nino/La Nina) and that occurs on a timescale of less than a year.
150 years is definitely a long enough period to discuss the global temperature changes. I'd say you can discuss it after 2 or so decades and have it be useful.
Are you an idiot. I am comparing this to the same accepted temperatures of 1750 the IPCC is using. I am not attempting to quantify CO2 forcing, but showing proof that how the IPCC quantifies it is in error.
can you follow, or do you wish to continue to respond foolishly?
Except nobody seems to properly eliminate the error in global temperature changes due to urban islands.
Yeah - those urban heat islands are really throwing off satellite measurements and yeah its so hard to remove city weather sites from the temperature record and recalculate.
Guess what happens when you do that? It doesn't bode well for your assertion.
No, I cannot follow your poor logic. IF you're trying to prove a measurement of something is wrong, then you ARE trying to quantify it. The temp has risen a certain amount. If you're attributing more of that heating to a specific source and not another you most certainly ARE trying to quantify those factors. We have a very good 30 year measurement of solar energy and a good temperature record for that time as well.
Reconstruct it using your figures. Do your figures match empirical data or not? Its very simple.
Really - I just want to know how you can say the sun is more of a factor when its output is not changing at best or decreasing at worst. You realize what happens if you assign solar forcing a greater role in increasing temperature while its declining? You pretty much say that CO2 forcing is stronger than anticipated if that is your point.
Just make your theories jive with reality. Pretty basic stuff.
My point is the temperature is greater in the urban areas. These record temperatures people see are probably cause by the urban island effect more than global warming.
I never said Global Warming was not real. You know that. I am saying that most of what is being propagated is wrong when it comes to correlations to CO2.
Stop being a Chump. He keeps changing the goalpost. You say 150 years, so I explain the thermometers problems, then you switch to satellite...
Stop being a Chump asshole.
Do you seriously think this short time-frame accounts for a slow oscillating system?
Short time spans are useless. Too many other variables.
Can you say "lag?"
Can you show lag before then? Whats your basis for lag other than you need it to fit? Where does this lag show up otherwise?
Can you say reality?
, can you point me to ANYTHING that shows that temp lags changes in solar output? That is a of a new theory you just came up with.
I'm not going to. We have discussed this in the past.
The oceans absorb most the solar energy they see and are the largest part of the earth. This becomes latent heat.
I have also pointed out the difference between heat and temperature,. Did you follow that, or just again, saying the popular line as you were taught at your University of Indoctrination?
I brought this up asking a professionals viewpoint. Not your sorry ass' agenda.
Well then - it shouldn't be hard for you to provide some proof of this lag.
Please review our past discussions. Until then, bye.
Its pretty easy really - if the temp increases while the TSI decreases is due to the oceans releasing heat then obviously the oceans should be cooling.
Are they?
Are the oceans cooling?
BTW, I'm not stopping Agloco from responding. He can still read your post and comment as he sees fit. In the meantime, I like poking holes in your ever changing theory and watching you flop around more than a fish out of water.
Its the sun thats causing more warming!
Oh - its not really warming - the temperature record is unreliable due to Urban Heat Islands!!!!
Oh, its not urban heat islands its the oceans releasing heat that is causing the warming!
So yeah - let me know when those oceans start cooling.
Yes, I know. Maybe he isn't comfortable using his scientific knowledge in this topic. Can't blame him, especially if he agrees with me and then has to contend with the likes of you.
All these things you poke fun at have explanation. Again, review our previous discussions instead of acting like a 6 year old.
There are currently 1 users browsing this thread. (0 members and 1 guests)
 Posting Permissions