

 Reply With Quote
^^^^^
This graph is much, much better.
These graphs do not correlate with each other. Good grounds to point out that someone is manipulating data.

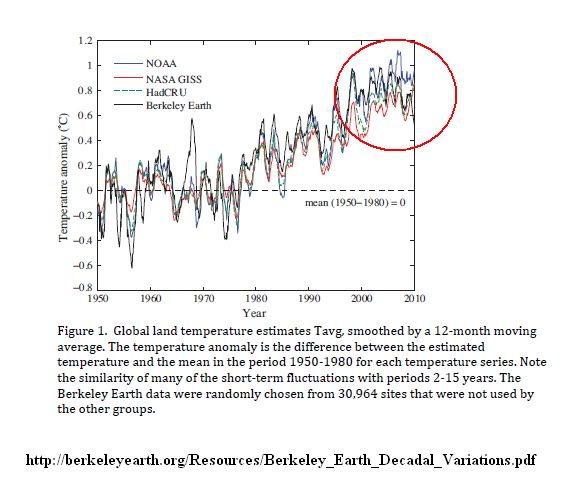
Look at BESTs graph Fuzzy:
See where I circled it? The Berkley Earth trend is actually negative starting near the end of the 90's.
^^^^^
This graph is much, much better.
These graphs do not correlate with each other. Good grounds to point out that someone is manipulating data.
They look like they could. I wonder what data points were used. The two do mesh together, but not perfectly. Now remember that the X axis are not the same scale.

I'll make this short and sweet. Anyone trying to use 11 years of data to prove AGW has stopped has a very bad grasp of AGW and climate science in general or is at the least making a very large fundamental mistake. Proceed as you will.
Correct.
We agree short term is meaningless. Interesting however how they decide what is and isn't important. Any time those us us, who use proper scientific skepticism... we are called deniers, as in a dirty word. No matter what time frame you guys use, it's OK. When we use any similar time frame, you somehow deem it meaningless. I also find it so comical that you AGW alarmists say how today's warming in unprecedented when we have proxy records that show the earth has been warmer... If I recall right... four times in the last 12,000 years.
Four times in the past, warmer than these greenhouse gasses are suppose to make it in these lase few decades.

I don't think 10 years of data proves anything either. Serious question: how many consecutive years of "stable" or downward trending temps would be needed to "falsify" AGW theory?
A 30 year trend is considered the threshold. So, in order for AGW to be considered stopped, a 30 year trend that is either neutral or downward would be needed to be seen. However, considering the volume of GHG entering the atmosphere, you need to see a 30 year trend that is significantly warm in order to continue with the current theories as well.
This is of course, all things being equal. For example, if the next 2 decades see a dramatic increase in pollution and volcanic activity and the SO2 content of the stratosphere increases to a point that it cancels out AGW heating, then that doesn't mean AGW is wrong. (I don't deem this likely in the least but thats not the point)
Oh, and the trend line for the last 11 years is not neutral or negative. It is positive. I think the underlying point that 11 years of data is insufficient to make a case for or against AGW is more important, however.
Like I said.
Always an excuse. Like when I pointed out in the past, about how in the 70's we started cleaning up pollution, allowing solar warming that started around 1900 and ended around 1950 to show it's full effect when the skies cleared.
We have a notable increase in solar energy during that approximate 50 years, yet you alarmists deny it.
discussing global warming with darrin is as useful as discussing creationism with maus.
Or trying to discuss almost anything with you.
By "discussing", do you mean posting ridiculous comic strips?

Good thing that your assertion comes with absolutely zero context.
Statistics can prove anything. 4% of people know that.
http://online.wsj.com/article/SB1000...136900828.html
Why I Remain a Global-Warming Skeptic
Searching for scientific truth in the realm of climate..
By FRED SINGER
Last month the Berkeley Earth Surface Temperature Project released the findings of its extensive study on global land temperatures over the past century. Physics professor Richard Muller, who led the study, heralded the findings with a number of controversial statements in the press, including an op-ed in this newspaper led "The Case Against Global-Warming Skepticism." And yet Mr. Muller remains a true skeptica searcher for scientific truth. I congratulate Mr. Muller and his Berkeley Earth team for undertaking this difficult task in the realm of climate.
The Berkeley study reported a warming trend of about 1º Celsius since 1950, even greater than the warming reported by the U.N.'s Intergovernmental Panel on Climate Change (IPCC). I disagree with this result, which perhaps makes me a little more of a skeptic than Mr. Muller.
Mr. Muller has been brutally frank about the poor quality of the weather-station data, noting that 70% of U.S. stations involve uncertainties of between two and five degrees Celsius. One could interpret the Berkeley study's results as confirmation of earlier studies and of the IPCC's conclusions, despite the poor quality of the stations used. But perhaps the issue is that the Berkeley study and the ones that came before suffer from common errors. I suspect that the temperature records still are affected by the urban heat-island effecta term given to any local warming, whatever its causedespite efforts to correct for this. The urban heat-island effect could include heat produced not only in urban areas, but also due to changes in land use or poor station siting. Therefore, I suggest additional tests:
1. Disassemble the "global average" temperature to get a better picture of what's going on regionally. This could involve plotting both the IPCC's and the Berkeley study's data only for tropical regions, separating the northern and southern hemispheres and testing for seasonal variation and differences between day and night.
2. Better describe what we can think of as the demographics of weather stations, a major source of possible error. The IPCC used 6,000 stations in 1970 and only about 2,000 in 2000. Let's examine their la ude, al ude and possible urbanization, and see if there have been major changes in the stations sampled between 1970 and 2000. For example, it is very likely that airports were used as temperature stations in both 1970 and 2000, because airport stations are generally of high quality. But airports are likely warming rapidly because of increasing traffic and urbanization. So if the number of airport stations remained constant at, say, 1,200 over that 30-year interval, the warming observed there might have increased between 20% and 60% over the same period of time, thereby producing an artificial warming trend.
3. The Berkeley study used a total of 39,000 weather stations, an impressive number. But again, we need to know if that number changed significantly between 1970 and 2000, and how the demographics of the stations changedboth for stations that showed cooling and for those that showed warming.
But the main reason that I am skeptical about the IPCC, and now the Berkeley, findings, is that they disagree with most every other data source I can find. I confine this critique to the period between 1978 and 1997, thereby avoiding the Super El Niño of 1998 that had nothing to do with greenhouse gases or other human influences.
Contrary to both global-warming theory and climate models, data from weather satellites show no atmospheric temperature increase over this period, and neither do the entirely independent radiosondes carried in weather balloons. The Berkeley study confined its findings to land temperatures as recorded by weather stations. Yet oceans cover 71% of the earth's surface, and the marine atmosphere shows no warming trend. The absence of warming is in accord with the theory that climate is heavily impacted by solar variability, and agrees with the solar data presented in a 2007 paper by Danish physicist Henrik Svensmark in the journal Proceedings of the Royal Society A.
Moreover, independent data using temperature proxiesvarious non-thermometer sources such as tree rings, ocean and lake sediments, ice cores, stalagmites, and so onalso support an absence of warming between 1978 and 1997. Coral data also show no pronounced warming trend of the sea surface, and there are good reasons to believe that reported sea-surface warming is an artifact of thermometer measurements.
The IPCC's 2007 Summary for Policy makers claims that "Most of the observed increase in global average [surface] temperatures since the mid-20th century is very likely [90-99% sure] due to the observed increase in anthropogenic greenhouse gas concentrations." While Mr. Muller now seems to agree that there has been such global average warming since the mid-20th century, he nonetheless ended his op-ed by disclaiming that he knows the cause of any temperature increase. Moreover, the Berkeley team's research paper comments: "The human component of global warming may be somewhat overestimated." I commend Mr. Muller and his team for their honesty and skepticism.
Mr. Singer is professor emeritus at the University of Virginia and director of the Science & Environmental Policy Project, with specialties in atmospheric and space physics.
You don't understand why I pointed that out, do you?
Sorry, but I thought you were more observant. I'll try not to make that mistake again.
I really wish people that wrote op eds were more informed on the subjects they write op eds on. Harping about the urban heat island effect is a tell tale sign of someone who is not up to date on the research. And by up to date, I mean the past DECADE.
For one, I would like it explained to me how Satellite measurements would be affected by the urban heat island effect. Once that is done, perhaps someone can tell me if there is a different trend among rural weather stations which would go a long way in proving a bias in urban stations.
Thanks.
BTW, Darrin, you should never claim that there are not people who believe the earth is not warming and then post an op ed from one.

That didn't stop you from posting a graph that appeared to indicate it does.
They aren't, which is perhaps why Singer prefers them. They also give a more complete/uniform sampling of the entire globe. Unfortunately, they only go so far back in time.
EDIT> Also, why do you suppose the two principal scientists responsible for the satellite temp record are sceptics?
Last edited by DarrinS; 11-07-2011 at 11:33 AM.
Actually, he disagreed with the rate of 1 deg. since 1950 and pointed out inconsistencies between datasets from 1970 to 1997. I don't think I read anywhere in the op ed that he thinks the Earth hasn't warmed at all.
This post points out the biggest failing of direct democracy.
Ignorant s like you get the same vote as someone who bothers to take the time to learn about things. It is a sad thing that the ignorant s vastly outnumber the conscientious informed.
Setting aside the fact that your post is a grammatical abomination, I can still get what you are trying to say.
Where your analogy fails is that you seem to equate both sides as having equal amounts of confirmation bias. They don't.
I am not saying I don't have confirmation bias. I do. Being aware of that, however, I can seek to mitigate it.
I do this primarily by admitting the weaknesses in my own argument, such as an amount of "groupthink" in climate science, and being honest about the stregths in Darrins arguments, such as we can't know for with high certainty how much we are really affecting our climate, and what those affects are.
When things that skeptics like to point out are posted, I genrally try to read and understand it.
The pseudoscientists of the denier movement almost never do either.
If one side actively tries to mislead, and the other appears to be trying to be as honest as possible, where do *you* assign credibility?
As for why the two scientists who developed the satellite record are skeptics, I can't say. I'm not inside their heads. However, what I can say, is that Spencer's track record of research being proven wrong is fairly strong.Moreover, independent data using temperature proxiesvarious non-thermometer sources such as tree rings, ocean and lake sediments, ice cores, stalagmites, and so onalso support an absence of warming between 1978 and 1997.
LOL @ I'm the one with a conformation bias here. I didn't even read that. So good.
There are currently 1 users browsing this thread. (0 members and 1 guests)
 Posting Permissions

