I'm sorry but scientific studies don't come in cliff's notes versions.
Holy !

I never said you claimed it wasn't a GHG. Talking with you is fairly hillarious because I'll say something akin to "the sky is blue" and you'll then respond with "I NEVER SAID THAT CLOUDS WERE MADE OF GLASS". Seriously making a gigantic case for yourself and your scientific comprehension.
A long fixed enclosure with atmospheric mixes? Yeah dude, all the studies I know replicated the Earth's atmosphere in a ing box. Tell us again how you comprehend this. Please?

I'm sorry but scientific studies don't come in cliff's notes versions.
Holy !


My answers:
Risen.1. When compared with pre-1800s levels, do you think that mean global temperatures have generally risen, fallen, or remained relatively constant?
Yes.2. Do you think human activity is a significant contributing factor in changing mean global temperatures?
Sorry, I'll have to read your answers later as I've reached my reading quota for the day.
Do you possibly have a cliff's notes version? Can you highlight the important portion of your answers I should focus on?
LOL...
Give yourself all the time you need to respond to my answers of those two questions. I must have baffled you, but that does not surprise me as you seem to rarely understand what say.

So now that you finally admit that then do you think this is something that we should try and prevent or curtail?
I'm not "finally" admitting anything. I have advocated reducing black carbon emissions for a long time.
Kirk: Still, "old friend!" You've managed to kill everyone else, but like a poor marksman, you keep missing the target!
Oh yeah I forgot that in the context of the CO2 content of the ocean your overexaggeration of the effects of soot was somehow meaningful. Your bait and switch routine is lame.
You dumb ass probably thinks that the soot accounts for increased ocean temperatures too.
So given that how about you explain how equilibrium is reached when the temperature of water is increased but there is also an increase in soluble CO2 observed.
Not a bait and switch. I have posted NASA data in the past about soot. the IPCC has upward revised their assessment of soot at least twice since AR4. The more it is studied, the more scientists are saying it was an impact.
It has some effect, but not all of it.
I already explained that. I'm sorry if your dumb ass cannot comprehend it.
Here is a sample of how it works. the numbers may be off because I am simple illustrating a point.
The accepted levels for CO2 in the atmosphere was about 284 ppm in the 1700 and about 387 around 2004. This equates to about 550 GtC and 750 GtC in the atmosphere. If in the past, there was 38800 GtC of carbon between the atmosphere and ocean, the ocean would contain 98.6% of it. In these last few hindred years, if we added 400 GtC of carbon, and the ocean absorbed 98.6% of it to maintain the same balance, only 16 GtC would have been added in the atmosphere, and 384 would have been added to the ocean. However, we know that about half of this was added to each. Warmer ocean temperatures change the balance. What if, instead of today, equalizing at 98.6%, it can only equalize at 98.1%? Well, this is the case that means the ocean has only absorbed about half of what we added. You see...
past... 550 GtC atmosphere, 38,800 GtC ocean, 39,350 GtC total, with the ocean at 98.6%.
present... 750 GtC atmosphere, 39,000 GtC ocean, 39,750 GtC total, with the ocean at 98.1%.
Now, if we didn't add any CO2 to the system, 98.1% of the 39,350 GtC would have the ocean at 38,602 GtC and the atmosphere with 748 GtC. Only two less GtC of carbon than mankind has added. the ocean would have been a net source of 198 GtC
Now, if the ocean did not increase in temperature, and equalized at the 98.6% as we added CO2 with industrialization, then today we would have about 556 GtC of carbon vs. the 550 GtC those 300 years back.
Now there are some factors that lessen this example, but this is obviously above your head already.
Last edited by Wild Cobra; 03-07-2012 at 02:48 AM.
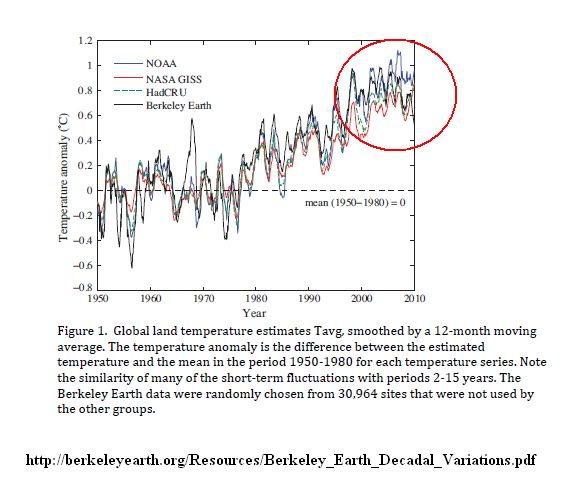
Does this one help, it is from BEST:
The BEST data in the graph is the black, and shows a slight lowering of temperature from 2000 to 2010.The link has changed to:
Decadal Variations in the Global
Atmospheric Land Temperatures
Fizzy
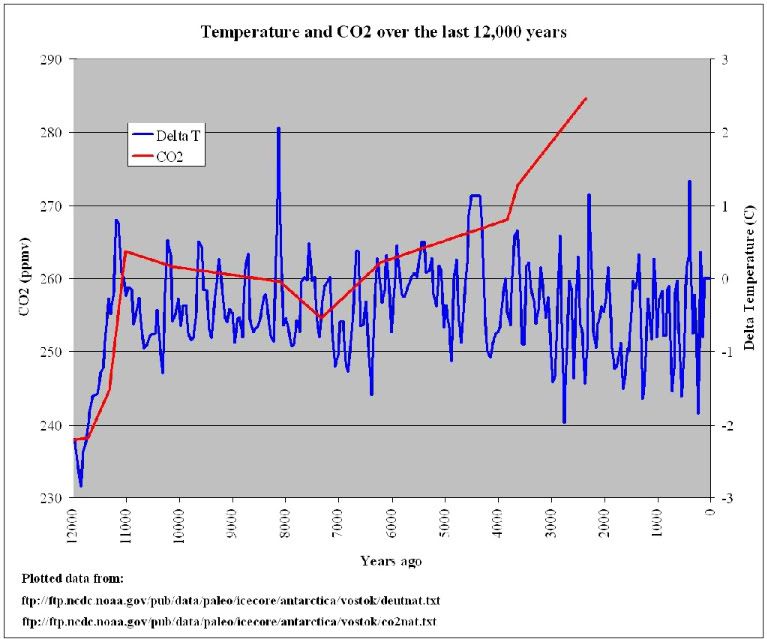
This is data from NOAA that is widely accepted in the scientific community, put on to a graph.
Notice:
1) CO2 lags temperature.
2) about 4000 years ago, when CO2 increased, temperature didn't.
3) natural temperature variations are +/- 2 degrees C.
I didn't ask you to regurgitate someone elses numbers. Whats the formula used to determine the equilibrium point. And pulling other people's work and not citing it is pretty ty.
When I say that you are stupid, i point to specific things that you do not understand. All you are doing here is throwing out numbers from other people's works doing absolutely nothing to describe how those numbers are reached and then posturing. Thats weak ass .
Right off the bat your little percentages nonsense assume that the system is linear. i know for a fact that soluble gas systems are not linear and its also obvious that there will be feedback because the change is not ph neutral.
Your napkin math is cute and all but justify the numbers.
Specifically this
i will even acknowledge a simplification assuming averaged ocean pH and salinity. Hope you photobucketed or bookmarked that mailer too.However, we know that about half of this was added to each. Warmer ocean temperatures change the balance. What if, instead of today, equalizing at 98.6%, it can only equalize at 98.1%? Well, this is the case that means the ocean has only absorbed about half of what we added. You see...
past... 550 GtC atmosphere, 38,800 GtC ocean, 39,350 GtC total, with the ocean at 98.6%.
present... 750 GtC atmosphere, 39,000 GtC ocean, 39,750 GtC total, with the ocean at 98.1%.
The first graph from BEST, yup, but your mailer parroting ass ignores the conclusion of the decadal variation paper. Specifically,
http://berkeleyearth.org/pdf/berkele...variations.pdfGiven that the 2-15 year variations in world temperature are so closely linked to the AMO raises (or re-raises) an important ancillary issue: to what extent does the 65-70 year cycle in AMO contribute to the global average temperature change? (Enfield, 2006; Zhang et al., 2007; Kerr, 1984.) [b]Since 1975, the AMO has shown a gradual but steady rise from -0.35 C to +0.2 C (see Figure 2), a change of 0.55 C. During this same time, the land-average temperature has increased about 0.8 C. Such changes may be independent responses to a common forcing (e.g. greenhouse gases); however, it is also possible that some of the land warming is a direct response to changes in the AMO region. If the long-term AMO changes have been driven by greenhouse gases then the AMO region may serve as a positive feedback that amplifies the effect of greenhouse gas forcing over land. On the other hand, some of the long-term change in the AMO could be driven by natural variability, e.g. fluctuations in thermohaline flow. In that case the human component of global warming may be somewhat overestimated.
In conclusion, our analysis suggests that strong interannual and decadal variations observed in the average land surface temperature records represent a true climate phenomenon, not only during the years when fluctuations on the timescale of 2-15 years had been previously identified with El Nino events. The variations are strongly correlated with the similar decadal fluctuations observed in the Atlantic Multidecadal Oscillation index, and less so with the El Nino Southern Oscillation index. This correlation could indicate that the AMO plays an important intermediary role in the
influence of the Pacific ENSO on world climate; alternatively, it might indicate that variability in the thermohaline flow plays a bigger role than had previously been recognized. The models could be tested by studying the temperature correlations in the ocean as a function of location and time. A 9.1 ± 0.4 year cycle is observed in the pre-whitened AMO, but it contributes only 30% to the variance. A similar cycle at 9.0 ± 0.5 years is seen in the PDO.
Essentially what they are saying is that relative to the historic fluctuations there is significant climate change. That if you account for noise in decadal variations then there is significnat climate change thus the name of the ing paper.
The last is some cherry picked individual core samples that I am not going to bother looking up.
RG was very apt in his thread le. So far we have unjustified numbers, graphs without context that do not even acknowledge what role it played in the study t was cited from, and some more mailer regurgitation that we are licky enough that you uploaded to photobucket.
You wow nobody with your pseudoscience bull .
Fuzzy, you miss why I said and posted what i did. you are always jumping to improper conclusions. Rather than ask to clarify, you go off on rants.
Did you read the last sentence in my example post?
Just because I didn't take the time to list them doesn't mean you are schooling me, head.
The ice core samples are not cherry picked. They are accepted NOAA data. If you wish not to accept them, take that up with NOAA.
The BEST graph I picked was to show Darrin's claim was accurate. It doesn't matter what the cause is, his claim is correct. temperature effectively did not rise by BEST's own data from 2000 to 2010.
I'm done with your sorry ass for now. All you do is whine, complain, lie, etc. no matter what I say.
So you choose not to address a thing that i say. i did ask for clarification. i asked where you derived the numbers from. Did you attempt to justify or derive them? nope you make a broad statement saying that i never asked for clarification when what I asked was where you got the numbers from.
of course there are other factors thats why I made it a point to say that i would even take average ocean salinity and ph as a baseline to begin with. Whats obvious is you have no idea how what the function for the equilibrium constant for CO2 solubility is and you pulled those numbers from out of your ass or from a mailer.
You claim that i make assumptions but you never ever actually address what i say beyond claiming that what I say are assumptions.
What is the solubility equation and can you justify the numbers you cited?
As for the BEST graph you just ignore the point of the paper. It was correct in that it came from BEST. It was an analysis of raw data adjusted for decadal variations. Pulling the raw data from the study and making claims off of it as to what BEST actually does is horse and even your dumb ass should recognize that.
As for the final, its accepted what? its a graph of the last several samples of hundreds of data points. Here they are in entirety:
ftp://ftp.ncdc.noaa.gov/pub/data/pal...tok/co2nat.txt
Sure enough its cherry picked. This is what the graph looks like when you take the data points back the full 500k years:
Also if you read the various literature on the core taking there were issues with contamination on the edges so its little surprise that your oil lobby mailer would choose to only display the data from the edges.
And you have the audacity to call me a liar?

I recently visited a clinic about 1.5 hours west of Philly. They stated that this had been a very mild winter and that there had been no snowfall for the first time in over 25 years.
Evidence keeps mounting IMO.
Um, if we didn't add any carbon to the system then the ocean would still be in balance. Talk about some incredibly ty understanding of how the carbon cycle works, but what is worse is your math. The reason the ocean has a lower concentration of the total CO2 today is not because its absorbing less but because we're dumping it directly into the atmosphere!!!!!
Please, tell us again what is over who's head. Please.
I mean seriously? You give the numbers for when the ocean was in balance with the carbon cycle and then when you want to erase what we've put in you magically lower that balance with percentage figures from a completely different situation?
Wow man.
In order to be fair and with all due respect, thats not evidence. 25 years ago they had a snowless winter too (according to what you said). A single winter without snowfall means no more or no less on its own than a single winter with extremely high snowfall (which given its location in PA they've probably had very recently).
On the other hand, a 30 year trend of increased temps is climatic evidence. In one winter season, however, there are simply too many independent variables that can sway it one way or another.
As of right now, there are studies coming out that do statistical analysis to try and show that many of these events that are occurring in the short run (the Texas drought the recent Moscow heat wave as examples) have been made worse by AGW but I'm not very well versed in them as I've not taken a close look at them nor have I talked to my professors about them to get their insight. I tend to view them with a skeptical eye because I'm not sure what signal is there is possible to be separated from the noise but the statisticians working on them probably know much better than I do. I do think as we move forward this is going to both become easier, and a much more frequent direction of study.
To further expand on how stupid WC's theory is let me just point to the graph which Fuzzy posted. Its a well known graph that basically shows the glacial interglacial cycles due to the orbital variations.
Well, at no point on that graph are CO2 concentrations nearly as high as they are today.
In fact, you can see that CO2 oscillated between about 180 and 300 ppm. 2011's average CO2 reading was 390 ppm. That's about 133% of what its been before even when temperature's were higher than today. So how in the is that due to ocean warming when that wasn't the case before?
Also, if you look at that graph, you'll notice that the warming happens quickly and is followed by a longer tail. It takes longer to cool than it does to warm. Thats because once the CO2 concentrations rose due to warming, their increased GHE in the atmosphere was able to sustain the warm temps!
I mean really, if only we could come up with evidence for AGW.

So, what would you say about a 30 year cooling trend at the same time CO2 was increasing? (e.g. 1940s to 1970)
We're currently on year 14 of of no trend.
We've talked about that period before Darrin. Several times.
You know for someone that claims that you like what BEST has done, you really have no clue what they say. Either that or you are just playing the willfully ignorant shill.
From the Decadal Variations paper:
1998 would be 14 years ago right?Much attention has been given to the small Tavg maxima of 1998 and 2005. The
maximum in 1998 occurred during a very strong El Nino, and is plausibly associated
with that oceanic event [Trenberth, 2002]. In this study we examined the annuallyaveraged
global land temperature time series to study their possible correlation not
only with the El Nino Southern Oscillation index (ENSO; see NOAA [2005]) but with
the Atlantic Multidecadal Oscillation (AMO; see Schlesinger et al. [1994] and Enfield et
al. [2001]), the Pacific Decadal Oscillation (PDO, see Zhang et al. [1997] ), the North
Atlantic Oscillation (NAO, see Zhang et al. [1997], Hurrell et al. [1995]), and the Arctic
Oscillation (AO, see Thompson et al. [1998]). Three of these indices: ENSO, AMO, PDO,
are derived from sea surface temperature records, in the equatorial Pacific, the North
Atlantic, and the North Pacific respectively. Two of these, the NAO and the AO, are
derived from surface pressure differences at locations in the northern Atlantic and Arctic. We find that the strongest cross-correlation of the decadal fluctuations in
land surface temperature is not with ENSO but with the AMO. The AMO index is
plotted in Figure 2.
What interesting in the study is how they filter the noise by using running averages. The graphs you cherry pick don't ever do that. They talk abotu that here:
Well here is what they eventually conlude.Our analysis used the monthly land-surface average temperature records made
available by the four groups previously referenced: NOAA, NASA GISS, HadCRU, and
ours, the Berkeley Earth Surface Temperature group. The land temperature data were
smoothed with a 12-month running average (boxcar smoothing); this removes high
frequency (e.g. monthly) changes. The data prior to 1950 were noisier than the
subsequent data, primarily because the number of stations was smaller, and for that
reason we restricted the period for our analysis to 1950-2010.
If you don't understand this it means that given the climate fluctuations indices that they spent most of the paper showed correlated very strongly to observed facts, its hotter than it is supposed to be.A theory for decadal oscillations in the North Pacific was devised by Munnich [1998].
It involves an interaction between wind and the thermohaline circulation. Such
models predict broad spectrum of frequencies, and could drive the structure we see in
Figure 3(A), but we would not expect such a driving force to result in the narrow 9.1
yr peak. For more on exited internal modes, see Frankcombe et al. [2010] and
Sévellec et al. [2009, 2010] and the references therein.
Given that the 2-15 year variations in world temperature are so closely linked to the
AMO raises (or re-raises) an important ancillary issue: to what extent does the 65-70
year cycle in AMO contribute to the global average temperature change? (Enfield,
2006; Zhang et al., 2007; Kerr, 1984.) Since 1975, the AMO has shown a gradual but
steady rise from -0.35 C to +0.2 C (see Figure 2), a change of 0.55 C. During this same
time, the land-average temperature has increased about 0.8 C. Such changes may be
independent responses to a common forcing (e.g. greenhouse gases); however, it is
also possible that some of the land warming is a direct response to changes in the
AMO region. If the long-term AMO changes have been driven by greenhouse gases
then the AMO region may serve as a positive feedback that amplifies the effect of
greenhouse gas forcing over land. On the other hand, some of the long-term change in
the AMO could be driven by natural variability, e.g. fluctuations in thermohaline
flow. In that case the human component of global warming may be somewhat
overestimated.
Perhaps if you spent more time reading BEST's stuff and less time regurgitating the exact same from your mailers that BEST refutes directly, you would know.
What I want to know is wtf you even bother claiming to think they do good work when its obvious you have no idea what their work has been.
There are currently 2 users browsing this thread. (0 members and 2 guests)
 Posting Permissions