Reply With Quote
day by day if you are interested in not looking silly saying OMG 173 deaths today
https://fdoh.maps.arcgis.com/home/it...ltFSOrder#data

day by day if you are interested in not looking silly saying OMG 173 deaths today
https://fdoh.maps.arcgis.com/home/it...ltFSOrder#data

Last edited by RandomGuy; 10-02-2020 at 05:04 PM. Reason: unfair comment
Pretty much.
He keeps using that data. I don't think it means what he thinks it means.
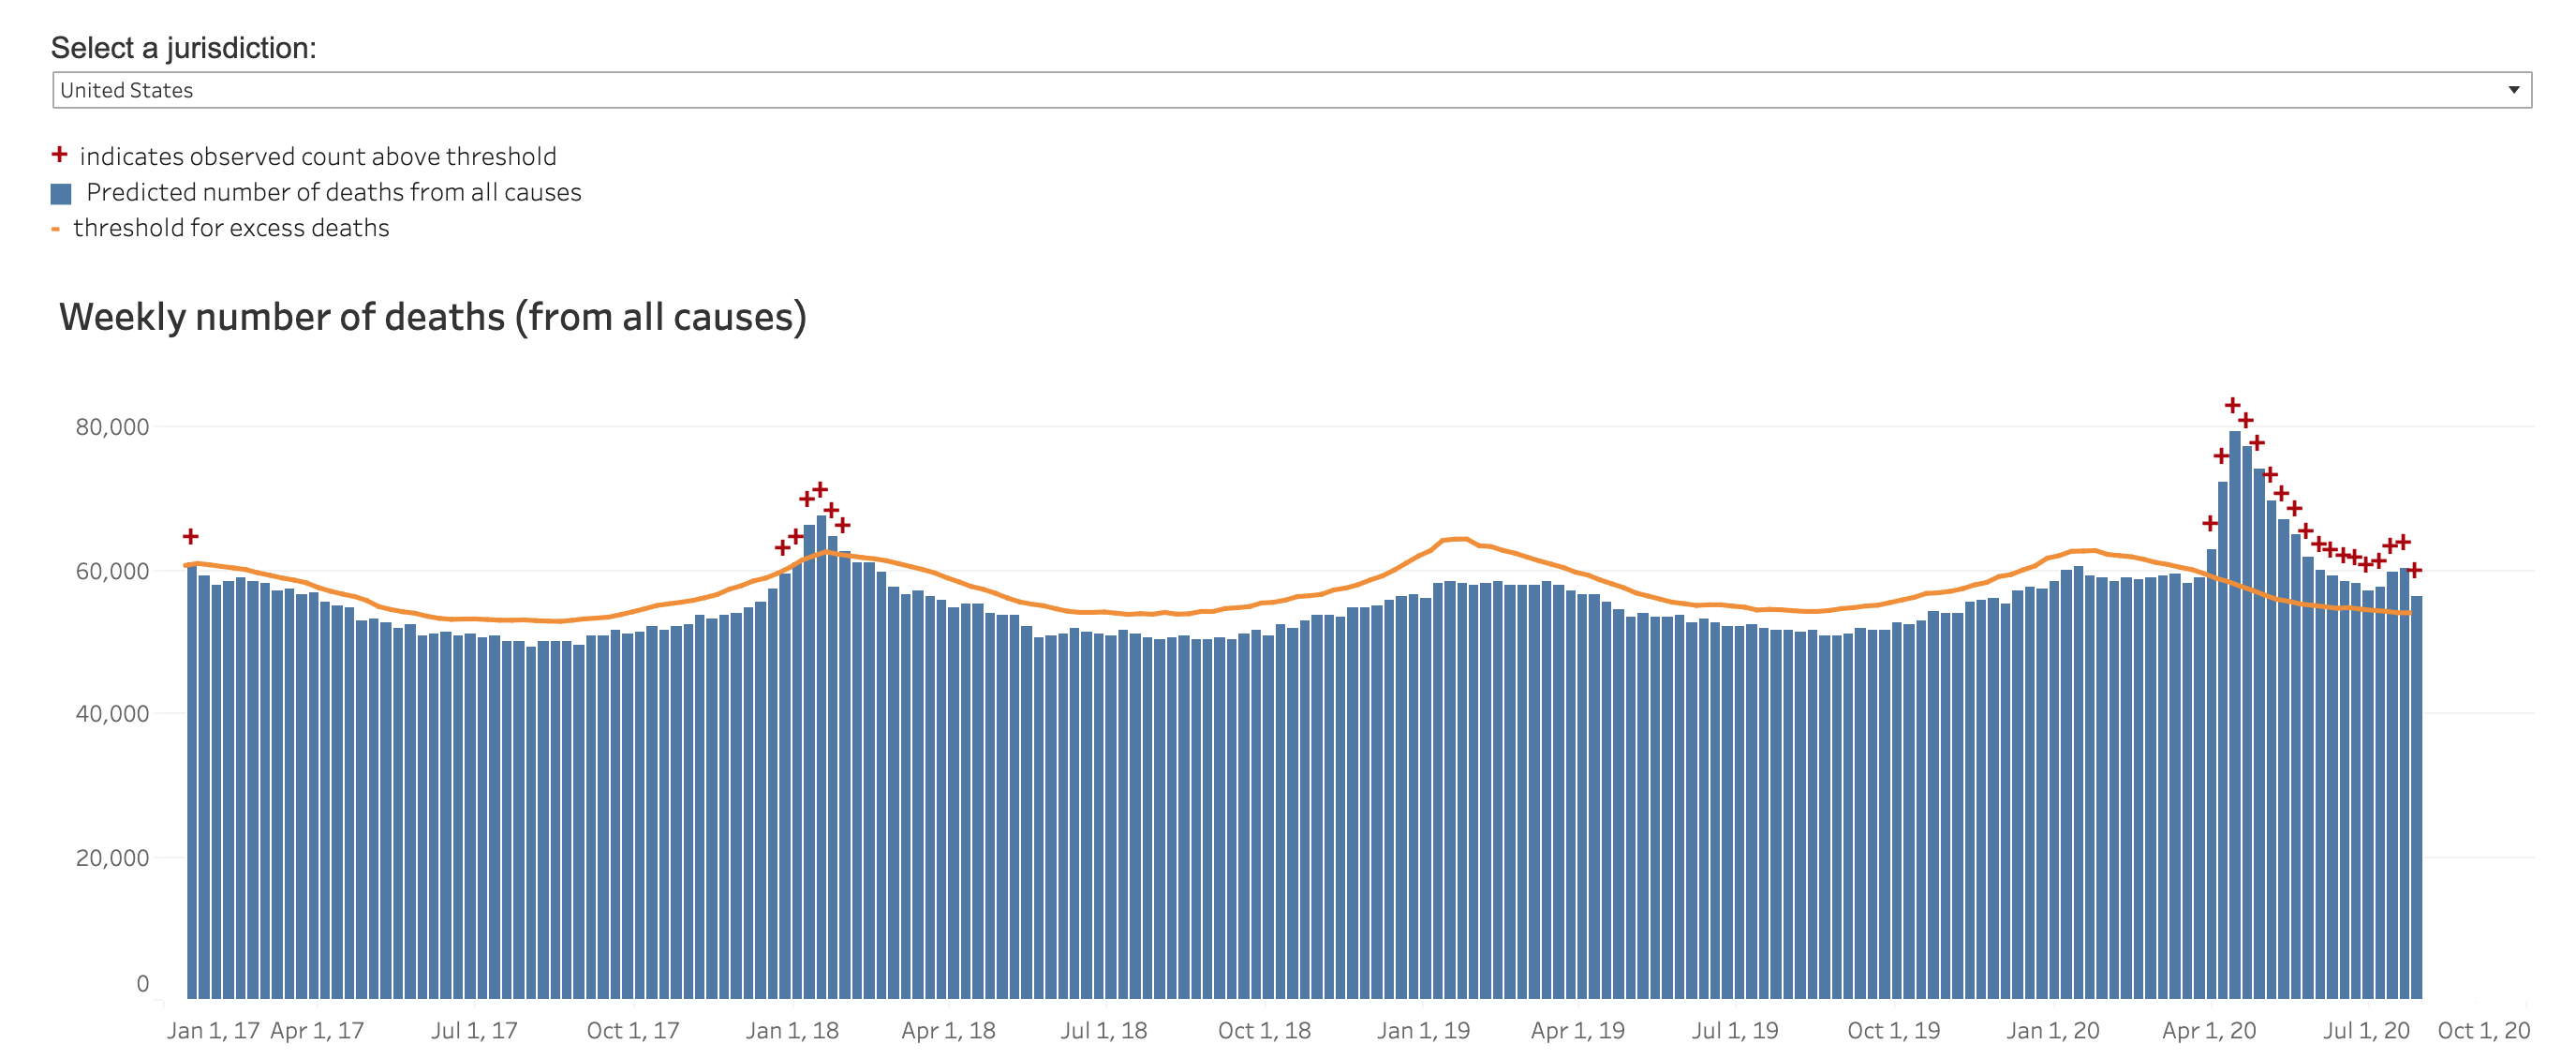
Jennifer Cabrera did some good work.
The presentation of the data by showing the date of the change and mapping that to the date of death was good.
It would be useful to get a sense of the average delay in tallying a death to a particular day. We use estimates like that in insurance when we estimate development for reporting years. "in the first year the data is generally 90% complete, second year 95%, third year 99%", so we can estimate reserves.
if you know what the reporting lag/development is, you can factor that into the data and get a reasonably good estimate as to what the actual count is going to be a lot quicker.

But if they're having to go an add deaths later on, that mean the 'daily' count is, at the very least, inaccurate?
In other words, if the daily count was accurate, they wouldn't need to go back and add 170 deaths over the last month.

But having 175 deaths in one day insinuates 175 people died on one day. internet pundits like to extrapolate and push the panic buttons.
It's just as disingenuous to point to daily deaths when you already know they're going to be corrected later.
At least grab a sample of a couple months get the average and see what that looks like.
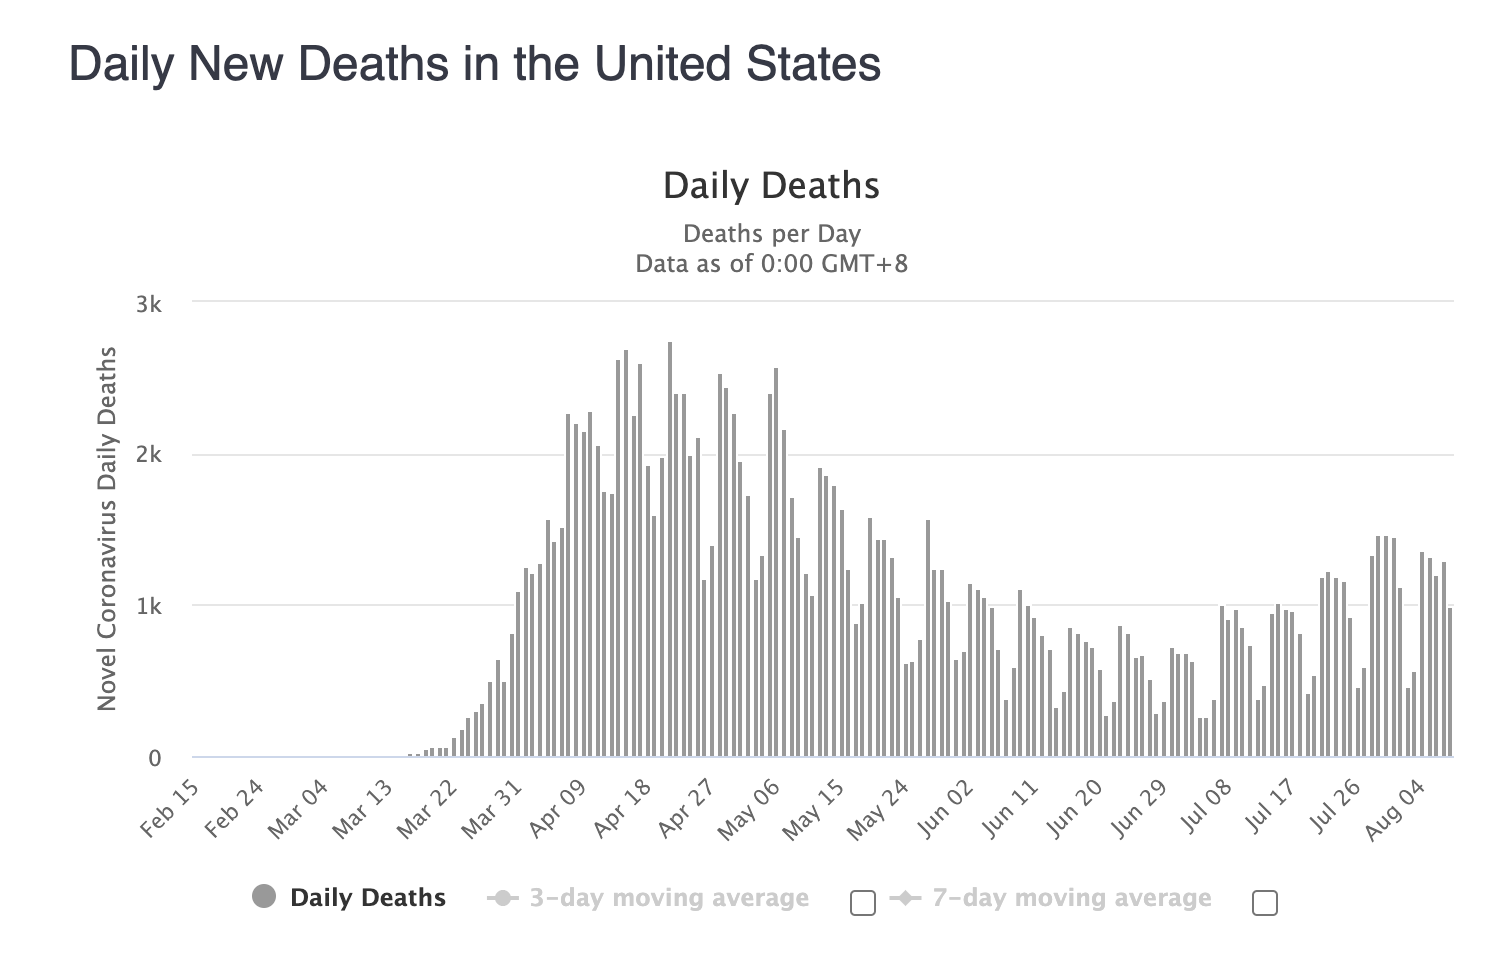
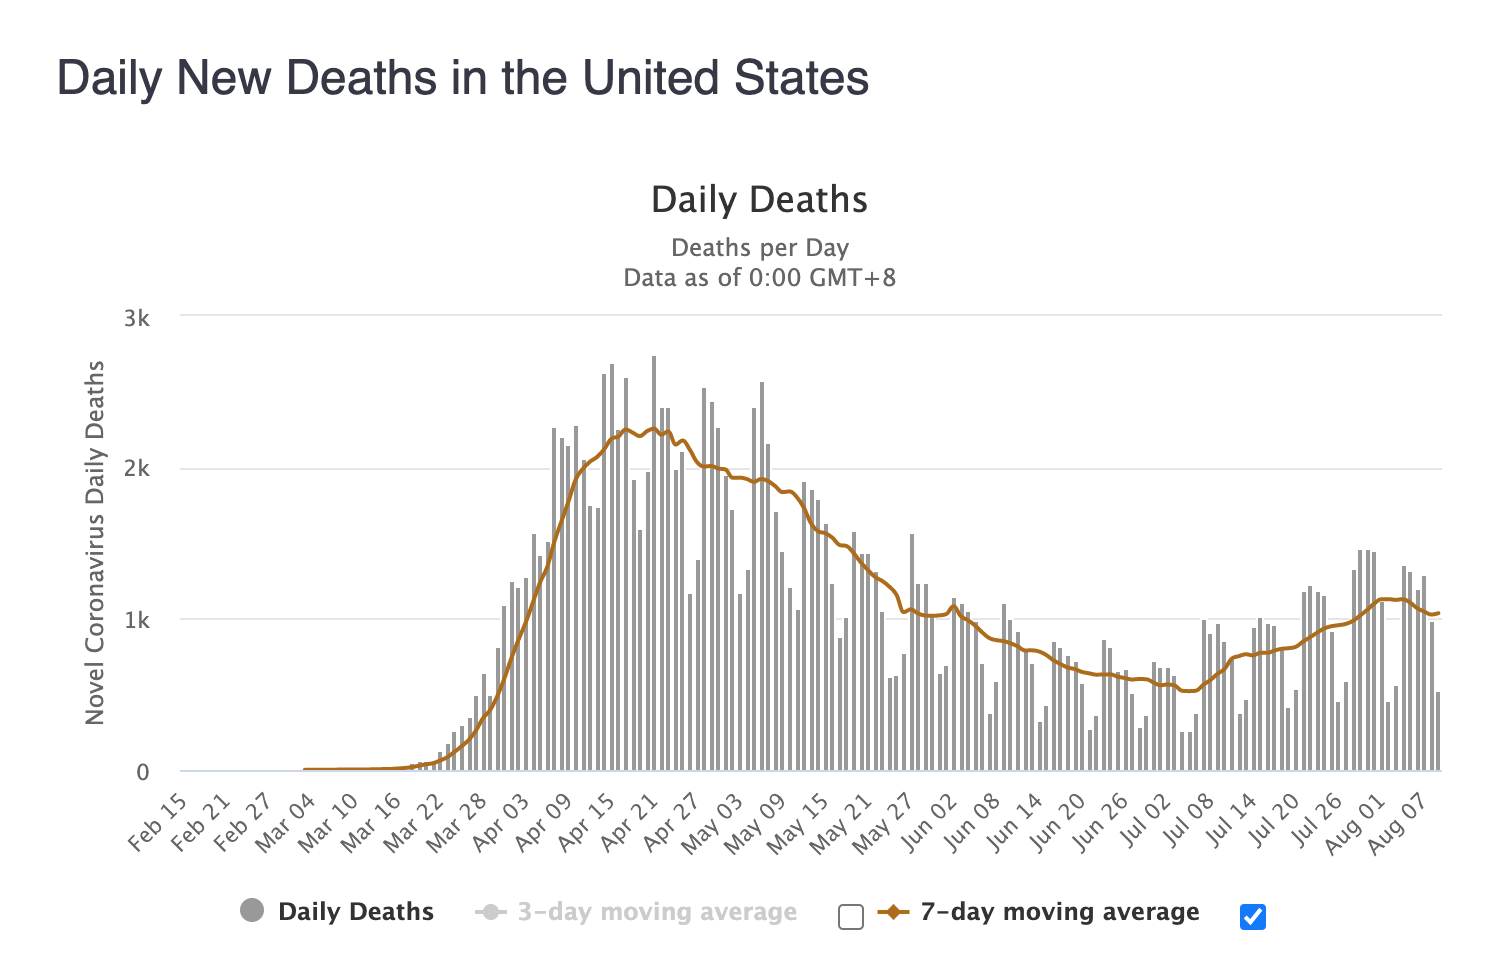
This is why I told SR21 to use a 7 day rolling average. Of course the forum pretended that was hilarious. Some of you are just now catching up. You not included.

All 7-day rolling average does is smooth out the differences between more deaths being reported on say Wednesdays vs Sundays.

... when i gave you a 7 day rolling average you whined about that too. that was the hilarious part

dem receipts
I wasn not ing about it. I was saying that it's just an overlay, but if you're going to highlight daily deaths and talk about records, you need to have your facts straight. Once again you illustrate you focus more on pedantry than on discussion. Your chart still showed daily deaths as well.
Which matters in discussions on daily deaths, unless you think people don't die on Sundays.
My electricity bill was zero for 3 months, then suddenly I get a bill for 1500 dollars. I need to find out why I used so much electricity in that 4th month.
Lololol 9 months later. Lololool you
Loloolooollpolollpplpllooll
Lololoooloooooloo
9
Months
Later
Bwahahahaahhahahaahahha
^

Yeah I can see how that electric bill dilemma could be a real calculator breaker for you
Bwahaha
Wrong wrong
It's an analogy, Blake. Death rate matters, but people like you focus on panic narrative and ignore rationality.
I'm making fun of your re ed analogy, DMC.
Beahajahhahahahahah
Ifr less than flu
tholdren rambling like he's got a fever and loss of smell
Here's one you might understand:
You find 3 ounces of semen in your bed on your wife's side of the bed. She was late coming home 4 nights last week. She hasn't let you her in 6 months. You suddenly think your wife is producing semen.
There are currently 2 users browsing this thread. (0 members and 2 guests)
 Posting Permissions