Reply With Quote
They're protesters, not rioters.

You said "crime to rise" and the chart is murder rate. How was the crime rate during the same period?
What part of which gun laws caused the decline in murder rate? Let's be specific. Was it the high capacity magazine manufacturing ban, the "evil features" ban, the 1986 FOPA?
They're protesters, not rioters.
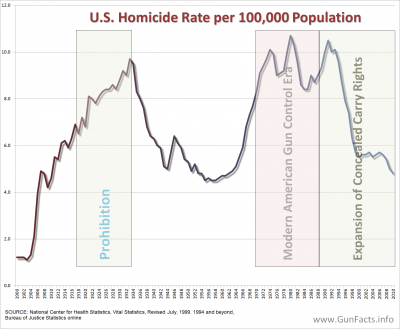
What does this chart say to you?
This is the UK

Sun's up guns up Trump shields activated

This is what we do with age of consent laws, driving laws, and drinking and gambling laws, the logic being a 13 year old isn't "mature enough," due to their stage of development to sign contracts or consent to sex or even vote.
You always seem to want an all or nothing solution to gun laws. My proposal wouldn't weed out all irresponsible gun owners, but it would weed out some, and some is better than none.
Looks like the trend (your graph is crime incidents) was skyrocketing until the 1996 ban.Handguns were banned for most purposes after the Dunblane school massacre in 1996
Gun laws WORK.
Here's the thing, though. I wouldn't want a full scale ban like the UK. We're a different culture where the gun is (unfortunately) an important part of US culture, especially in rural communities. I don't want to take away that from other people, so I'm okay with the "social contract" of trading some safety for rights, as we do with other things in life, like alcohol and tobacco consumption and other dangerous/risky activity.

knife/club whataboutism graph incoming
That's the conclusion you draw from this?
Which gun laws work in the US?

Chicago passed a ban on handgun ownership in 1982. ... In 2010, the ban was struck down by the U.S. Supreme Court, and in 2013, Illinois became the last state in the nation to approve concealed carry. Illinois is considered to have fairly tight gun laws.Dec 10, 2018
Where is that ban in that graph?
Wow, concealed carry doesn't help the homicide rate at all.
As has been well-do ented, much of the plunge in the national gun homicide rate took place in the mid-to-late 1990s, during which the rate was cut in half. In the years that followed, it stayed mostly level. It ticked up again in 2015, and likely increased again last year — final statistics aren’t out yet — driven by a ballooning gun-murder rate in a few cities. It’s unclear whether new regulations have done much to counteract this trend.
https://www.businessinsider.com/gun-...y-state-2017-6
So we now have open carry. Besides, we aren't cops. Our job isn't to reduce the homicide rate, just to prevent us being part of it.
Um, the difference is the UK's ban was NATIONAL, while this was citywide. Hmmm? Wonder how you can get a gun into the city? Oh, you buy one in Aurora and take it to Chicago!
And how about det trend after the gun law was struck down and concealed carry was allowed?

Assault weapons ban in '94. And how about many other countries around the world that saw their homicide and crime rate drop after nationwide handgun bans and such? They WORK.
But chill out. I don't want those bans here. Bubba can buy his toy if he proves he isn't a re .
If you want to coerce a point from a chart, you can draw a line between any date and the highest point and say they are related. You causally dismissed the years between though. This was during the Obama administration. Are you going to also draw that correlation or does that not fit your new epiphany of left good, right bad?
So you're saying with guns being legal in Chicago, the data doesn't illustrate it became easier for a criminal to acquire one? Then what is the purpose of new gun laws? Total ban seems like about as far as you could possibly go.
Last edited by DMC; 07-07-2020 at 01:47 AM.
I could easily make the point that CHL has coincided with decreased murder rates in the US. I could find charts to support any point I want to make. This isn't the point of CHL though and the Chicago issue wouldn't be resolved by CHL. It's a class separation issue, basically you have the French Riviera in some parts and Mogadishu in others. Where do you think the shootings occur?

Lets all pretend that you guys dont love black people killing black people.
Let's pretend you're a remote viewer and aren't also guilty.
It's often better to extrapolate trends over a period of time rather than day-by-day, year-by-year and what have you. Trends don't always emerge linearly.
It was also after the Rs took control of the house and senate. That said, Obama wasn't really left anyway. Never a fan.
I didn't need an epiphany to understand that left is good and right is bad (for the sake of the argument, I'm leaving out extremes, like communists and white nationalists, both equally ). I think the platform of the mainstream American conservative party is illogical, irrational, and harmful. It's a vacuous ideology that only makes sense if you really, really need a couple of more crumbs added to your yearly bottom line through their oh so generous tax cuts.
You would be disappointed with the people I hired.
About concealed carry permits:
What do I keep saying my demand of ALL gun owners is? Training.You have completed all the required training courses.
That said, it's funny how the maker of the graph left out the 1994 Assault Weapons ban. It's seems homicides were still sharply trending up at the beginning of the Concealed Carry era and then dropped after 1994 with the introduction of the assault weapons ban.
Gun laws WORK.
And yes, I wouldn't expect much of a change with an expansion of concealed carry since, as I've said, guns in the hands of PROVEN responsible gun owners likely doesn't tick up the murders.
Still not a good look for the right. In fact they look downright stupid. lol the right.
There are currently 1 users browsing this thread. (0 members and 1 guests)
 Posting Permissions