Page 1 of 2 12 LastLast
Results 1 to 25 of 39
  1. #1
    Believe. MaryAnnKilledGinger's Avatar
    My Team
    Miami Heat
    Join Date
    Oct 2008
    Post Count
    523
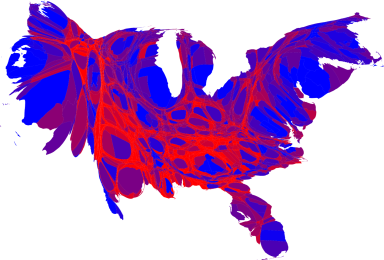
    Most of us are familiar with the red state/blue state, or even the red county/blue county maps. One thing that is traditionally confusing about such maps is how red they are. When a nation is mostly half and half, how can there be so much red? While we know the obvious answer is that rural areas have more land, but fewer people and tend to all lean red, it still seems not to represent the popular vote that we see reflected by the numbers.

    Well, this site has a guy who has worked out cartograms where the size of the land is adjusted in size to represent its population. He has also used shades of red and blue to make areas that are effectively even more purple.

    2008 shows a significant trend toward blue from the 2004 cartogram.

    The vascular symbolism in the images is also interesting to me. But I'm a geek that way.

  2. #2
    Veteran
    My Team
    San Antonio Spurs
    Join Date
    Dec 2005
    Post Count
    15,842

  3. #3
    I am that guy RandomGuy's Avatar
    My Team
    San Antonio Spurs
    Join Date
    Jun 2005
    Post Count
    51,121
    Not much of a surprise there, if you think about the math.

    Minimum number of congress members from any state is 3, so the smaller your population is compared to the minimum required for 4, the greater your vote counts.

    On the other end are the really populous states. As the population gets larger, the more the proportion will resemble the number required for one seat in the house of representatives.

  4. #4
    俺はまんこが大好きなんだよ baseline bum's Avatar
    My Team
    San Antonio Spurs
    Join Date
    Mar 2003
    Post Count
    97,881
    I like this map, since it doesn't take a black or white stance:


  5. #5
    fuk yo team clown tp2021's Avatar
    My Team
    San Antonio Spurs
    Join Date
    Sep 2007
    Post Count
    5,452

    2008 shows a significant trend toward blue from the 2004 cartogram.

    The vascular symbolism in the images is also interesting to me. But I'm a geek that way.
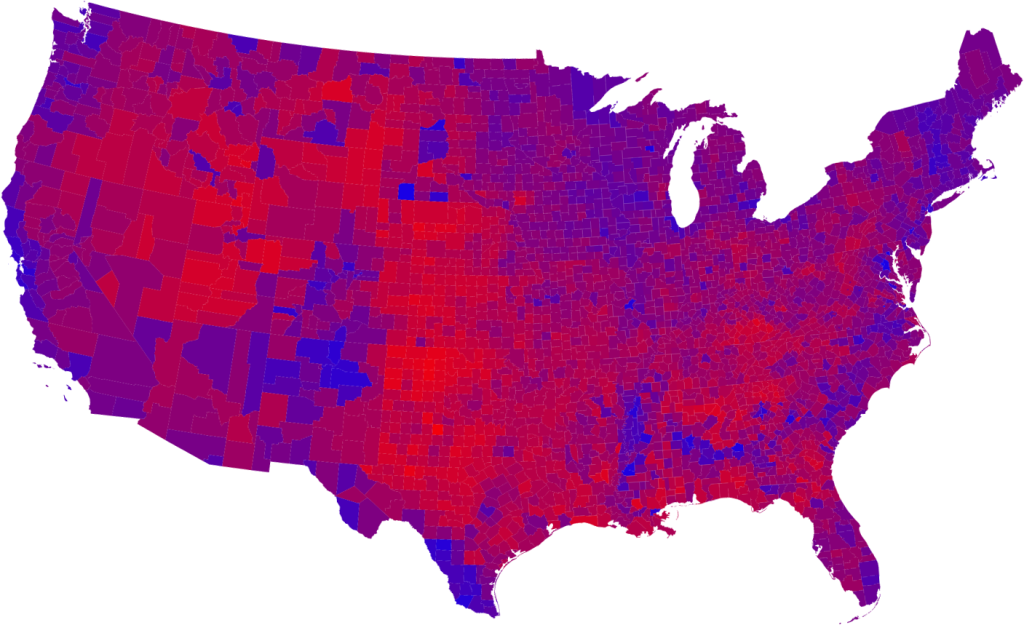
    It looks like a liberal goo monster breaking out of a conservative web.

  6. #6
    Still Hates Small Ball Spurminator's Avatar
    My Team
    San Antonio Spurs
    Join Date
    Jun 2003
    Post Count
    37,751
    Some of those look like Rorschach tests.


    It's the Dark Angel!

  7. #7
    Veteran DarrinS's Avatar
    My Team
    San Antonio Spurs
    Join Date
    Jun 2005
    Post Count
    42,561
    Texas should really be a separate country.

  8. #8
    e^(i*pi) + 1 = 0 MannyIsGod's Avatar
    My Team
    San Antonio Spurs
    Join Date
    Mar 2003
    Post Count
    57,943
    I like the ones on the Princeton election consortium better.


  9. #9
    e^(i*pi) + 1 = 0 MannyIsGod's Avatar
    My Team
    San Antonio Spurs
    Join Date
    Mar 2003
    Post Count
    57,943
    My favorite map right now though is this one. It shows how much the counties shifted and in which direction. What do you think the areas in red have in common?


  10. #10
    Believe.
    My Team
    San Antonio Spurs
    Join Date
    Oct 2005
    Post Count
    1,373
    My favorite map right now though is this one. It shows how much the counties shifted and in which direction. What do you think the areas in red have in common?

    lots of mexicans ?

  11. #11
    Believe.
    My Team
    San Antonio Spurs
    Join Date
    Oct 2005
    Post Count
    1,373
    all of this "data" is irrelevant. You all fail to consider the harsh truth - that conservatives had no vote. Lots of them stayed home. Added to which - the youth will grow up and get some values and morals and vote conservative - combined with the fact that the media pounded republican hate - republican blame for everything gone wrong with the country -- it was something like 90% positive reporting for the prez elect vs. 7% for Mcain.

  12. #12
    e^(i*pi) + 1 = 0 MannyIsGod's Avatar
    My Team
    San Antonio Spurs
    Join Date
    Mar 2003
    Post Count
    57,943
    Yeah, Mexicans dominate Arkansas, Oklahoma, Easter Texas, Louisiana and Appalachia.

  13. #13
    e^(i*pi) + 1 = 0 MannyIsGod's Avatar
    My Team
    San Antonio Spurs
    Join Date
    Mar 2003
    Post Count
    57,943
    all of this "data" is irrelevant. You all fail to consider the harsh truth - that conservatives had no vote. Lots of them stayed home. Added to which - the youth will grow up and get some values and morals and vote conservative - combined with the fact that the media pounded republican hate - republican blame for everything gone wrong with the country -- it was something like 90% positive reporting for the prez elect vs. 7% for Mcain.


  14. #14
    俺はまんこが大好きなんだよ baseline bum's Avatar
    My Team
    San Antonio Spurs
    Join Date
    Mar 2003
    Post Count
    97,881
    all of this "data" is irrelevant. You all fail to consider the harsh truth - that conservatives had no vote. Lots of them stayed home. Added to which - the youth will grow up and get some values and morals and vote conservative - combined with the fact that the media pounded republican hate - republican blame for everything gone wrong with the country -- it was something like 90% positive reporting for the prez elect vs. 7% for Mcain.
    Or maybe the youth is growing up and fed up with your right wing dogma.

  15. #15
    Believe.
    My Team
    San Antonio Spurs
    Join Date
    Oct 2005
    Post Count
    1,373
    Or maybe the youth is growing up and fed up with your right wing dogma.
    I would love to see similar maps with breakdowns - after say FDR - Hoover - Carter -- Reagan -- Clinton -

  16. #16
    Veteran
    My Team
    San Antonio Spurs
    Join Date
    Dec 2005
    Post Count
    15,842
    "it was something like 90% positive reporting for the prez elect vs. 7% for Mcain."

    Nearly all of that was due to Obama running a positive campaign, and McNasty running a character-assassination campaign, full of lies that even the timid media called him on eventually.

    When he started lying, the media were being balanced by giving his lies the benefit of the doubt. His lying became so egregious the media turned on him.

  17. #17
    Veteran DarrinS's Avatar
    My Team
    San Antonio Spurs
    Join Date
    Jun 2005
    Post Count
    42,561
    My favorite map right now though is this one. It shows how much the counties shifted and in which direction. What do you think the areas in red have in common?


    I don't know -- what do they have in common?

  18. #18
    e^(i*pi) + 1 = 0 MannyIsGod's Avatar
    My Team
    San Antonio Spurs
    Join Date
    Mar 2003
    Post Count
    57,943
    They're obviously filled with people making over 250k who were afraid of Obama's future tax policies.

    Obviously.

  19. #19
    Veteran DarrinS's Avatar
    My Team
    San Antonio Spurs
    Join Date
    Jun 2005
    Post Count
    42,561
    They're obviously filled with people making over 250k who were afraid of Obama's future tax policies.

    Obviously.

  20. #20
    Orange Whip? Orange Whip? Viva Las Espuelas's Avatar
    My Team
    San Antonio Spurs
    Join Date
    Nov 2005
    Post Count
    19,497
    They're obviously filled with people making over 250k who were afraid of Obama's future tax policies.

    Obviously.
    are serious?

  21. #21
    e^(i*pi) + 1 = 0 MannyIsGod's Avatar
    My Team
    San Antonio Spurs
    Join Date
    Mar 2003
    Post Count
    57,943
    Maybe I am, Maybe I'm not.


    Do you have an opinion on why republican voting in these areas went up while it went down in the rest of the country? Are they simply more Pro America?

  22. #22
    Orange Whip? Orange Whip? Viva Las Espuelas's Avatar
    My Team
    San Antonio Spurs
    Join Date
    Nov 2005
    Post Count
    19,497
    Maybe I am, Maybe I'm not.


    Do you have an opinion on why republican voting in these areas went up while it went down in the rest of the country? Are they simply more Pro America?
    i really don't know why. one thing i would like to know is what the percentage of straight ticket voting was according to both parties. for this and the 2006 election. personally i think everyone is on the bushbash bus. i'm no hardcore supporter of him though or the republican party. if you screw up, you screw up. i'll leave the pro-american judgement up to you and the like.

  23. #23
    e^(i*pi) + 1 = 0 MannyIsGod's Avatar
    My Team
    San Antonio Spurs
    Join Date
    Mar 2003
    Post Count
    57,943
    Obviously there was a lot of sentiment to vote against Bush in the nation and that is one of the leading reasons the nation as a whole voted strongly for the democratic candidate and why their share of the vote went up almost universally.

    That's exactly why there must be some other reason - and i'll stop beating around the bush and say what everyone here knows it is: racism - that Eastern Texas, Louisiana, Arkansas, Oklahoma and Appalachia all saw in increase in percentage of the vote for the Republican candidate while the rest of the country did not.

    Now, since I know you're a bit slow in the reading comprehension department let me break it down for you a bit more so you don't misunderstand. No, not everyone who voted for McCain is a racist and no not everyone who voted for McCain in those areas did so on the basis of Obama's race and yes many of Obama's voters were racist themselves in the opposite way. However, it is extremely clear that McCain saw his percentage of the vote rise to levels higher than Obama on the levels of increased racism in these areas.

  24. #24
    Still Hates Small Ball Spurminator's Avatar
    My Team
    San Antonio Spurs
    Join Date
    Jun 2003
    Post Count
    37,751
    I'd add that Arkansas looks especially strange, and an additional factor could have been Hillary loyalists.

  25. #25
    Orange Whip? Orange Whip? Viva Las Espuelas's Avatar
    My Team
    San Antonio Spurs
    Join Date
    Nov 2005
    Post Count
    19,497
    Obviously there was a lot of sentiment to vote against Bush in the nation and that is one of the leading reasons the nation as a whole voted strongly for the democratic candidate and why their share of the vote went up almost universally.

    That's exactly why there must be some other reason - and i'll stop beating around the bush and say what everyone here knows it is: racism - that Eastern Texas, Louisiana, Arkansas, Oklahoma and Appalachia all saw in increase in percentage of the vote for the Republican candidate while the rest of the country did not.

    Now, since I know you're a bit slow in the reading comprehension department let me break it down for you a bit more so you don't misunderstand. No, not everyone who voted for McCain is a racist and no not everyone who voted for McCain in those areas did so on the basis of Obama's race and yes many of Obama's voters were racist themselves in the opposite way. However, it is extremely clear that McCain saw his percentage of the vote rise to levels higher than Obama on the levels of increased racism in these areas.
    keep your cause alive.

Thread Information

Users Browsing this Thread

There are currently 1 users browsing this thread. (0 members and 1 guests)

Posting Permissions

  • You may not post new threads
  • You may not post replies
  • You may not post attachments
  • You may not edit your posts
  •