Reply With Quote
No dude, your math is off, but it's is par for the course for you. $50 monthly savings for every $35k in income

Here is my corrected responce, a redo of post #45:
Cutting SS insurance completely on wage earners would only give the top wage earners $373.80 a month more. Us little people would get to keep $35 more monthly for every $10k we earn annual.
The 2011 SS insurance cut I say was a mistake. However, the highest wage earners only get a $178 per month break.
SS insurance for 2011 went down to 4.2% from 6.2% (-2%). The cap is at $106,800. 0.2 x $106,800 = $2,136 annual, or $178 a month.
This is a savings of $200 for every $10k annually, up to the limit. $50 monthly for every $30k annual.

No dude, your math is off, but it's is par for the course for you. $50 monthly savings for every $35k in income
Dude, you're sounding more and more re ed. Here it is in simple terms. don't make it any more complicated.
$51,000 median income. 6.2% tax ( i'm aware of the tax cut). 6.2% x $51,000 per year = $3162 per year. $3162/12 = $263 per month.
$51,000 @ 4.2% per year is $178.5 per month.
If anything SS insurance rates need to be increased. Not decreased. It's part of the pot the government spends out of. We need more tax payers, not less.
Want to increase the spending of consumers, eliminate tax deductions and tax credits, and make a flat way somewhere between 20% to 25%. make it so consumers and business know what to expect year to year.
I know, you will cry for the poor, but everyone should pay taxes. Leave in exemptions. That's all any of us need at most. I would personally do away with all exemptions as well and tax at about 16% to 19%.
This idea of completely eliminating SS for a few years is real scary. This is the type of thing that when it's time to start again, there will be enough voices that cry "raising taxes on the poor" and calling it "regressive" that once eliminated, it will never return. Then we get to a point where more than 50% have no money supporting government costs. they will then, not only put politicians in place who give them free health care, but shoot for the sky. Free cars, free houses, etc. etc. etc.
Look again.
That is the current savings for 2011 vs. 2010.
The SS rate in 2010 was 6.2%. It is 4.2% for 2011. That is a 2% difference. 2% of $30k is $600. $600/12=$50.
You are misquoting me. I said $30k not $35k. I can't change what's in my quote of your quote in post #49. see for yourself. I said $30k.
The only mistake I made as the $102k vs. the $106.6k. Though I wrote down the wrong number, I still calculated at the $106.8k.

After five days of open bar action, it took me a while to figure out who "shrub" was......
I hope Barry pulls a shrub plus then. I think Teysha mentioned it: Let me decide which watering hole to support.
As my limited knowledge of finance and government debt goes, shouldn't the government take a page from the average American household? For us it's not about our salary, it's about our expenditures. Why is the paradigm different at the federal level?
Last edited by Agloco; 06-08-2011 at 09:56 PM.
It shouldn't be any different, but all spending is someone's sacred cow.
I say start eliminating subsidies and eliminate programs that are controversial as being authorized for congress by cons ution.
Simplify taxation and phase out, or significantly reduce the IRS.
We were just fine before the Department of Education was started. Actually better before government started with it's nationalized standards. Now schools are teaching to the lowest common denominator. I say phase out this department and others.
One by one, no single cost will fix it. Find several and add the costs together, and we make some headway.
We simply have too big of a government. We don't need this much.
At the end of the day, I'm glad I don't get as much government as I pay for. Too much BS already.
Then there is the never ending cry for more individual tax credits and tax deductions. I'm sorry, fix this with that simplified tax structure. Redistribution or wealth via tax credits is simply wrong.

Because it's not their money and their job isn't dependent on it, at least in the short term. It's like running a company with 500+ treasurers. Add the fact that the fiduciary duty is to donors/lobbyists and you have the recipe for disaster.
All that said, it's not democracy that's the problem. It's the fact that over time politics stopped being about the people, but shifted into appeasing the largest interests who funnel enough money for the candidates to run (which nowadays is obviously a lot of dough). It's a really ed up vicious circle, and killing legislation that barred secret campaign contributions only enhance it.
Any thoughts on military spending? You know, the largest spending outside of interest payments?
There's no silver bullet. It's going to have to be an increase in revenue through a tax hike and at the same time cutting on spending across the board.
Well, we still have the lowest military spending both war time and peace time as a percentage of government spending as in the decades past.
It's social spending that keeps rising uncontrolled. I will agree we can find military cuts.
Here, I took the time to back up what I am saying. From the CBO:
I extracted the data from Table 4.1Outlays by Agency: 19622016 and removed these last line items before totaling the columns and converting to percentage:
Social Security Administration (On-Budget)
Social Security Administration (Off-Budget)
Other Independent Agencies (On-Budget)
Other Independent Agencies (Off-Budget)
Allowances
Undistributed Offsetting Receipts
(On-budget)
(Off-budget)
I did so because SS is suppose to be it's own en y, and the other minor numbers had no data for some years. I could go back and replace the .... with zeros.
Anyway, look at how military spending was a major part of the budget in the past. Look at how the social welfare system has clearly beaten out military spending.
Why is the IRS and other treasury functions so high? Think we should simplify the tax system?
I suggest you research the OMB site sometime, instead of listening and repeating other people's propaganda. This table and others are found here.
Last edited by Wild Cobra; 06-08-2011 at 11:53 PM.
We do not need to increase taxes. That is counterproductive, especially in times like this where the long term damage is more than the short term gain.
We need more tax payers. We now have a systems where something like 47% of all tax filers pay no net money, or get more back than they paid in. This is a ridiculously high number. We need to fix the problems that cause this to happen, not amplify them by pushing more job providers to outsource labor.
I don't have Excel here, but something doesn't jive there... This is the 2010 federal budget:
The President's budget request for 2010 totals $3.55 trillion. Percentages in parentheses indicate percentage change compared to 2009. This budget request is broken down by the following expenditures:
Mandatory spending: $2.173 trillion (+14.9%)
$695 billion (+4.9%) Social Security
$571 billion (+58.6%) Other mandatory programs
$453 billion (+6.6%) Medicare
$290 billion (+12.0%) Medicaid
$164 billion (+18.0%) Interest on National Debt
Discretionary spending: $1.378 trillion (+13.8%)
$663.7 billion (+12.7%) Department of Defense (including Overseas Contingency Operations)
$78.7 billion (−1.7%) Department of Health and Human Services
$72.5 billion (+2.8%) Department of Transportation
$52.5 billion (+10.3%) Department of Veterans Affairs
$51.7 billion (+40.9%) Department of State and Other International Programs
$47.5 billion (+18.5%) Department of Housing and Urban Development
$46.7 billion (+12.8%) Department of Education
...
The figures come from the GAO (link).
The 2009 budget (while Dubya was still the emperor) wasn't much different:
The President's budget for 2009 totals $3.1 trillion. Percentages in parentheses indicate percentage change compared to 2008. This budget request is broken down by the following expenditures:
Mandatory spending: $1.89 trillion (+6.2%)
$644 billion - Social Security
$408 billion - Medicare
$224 billion - Medicaid and the State Children's Health Insurance Program (SCHIP)
$360 billion - Unemployment/Welfare/Other mandatory spending
$260 billion - Interest on National Debt
Discretionary spending: $1.21 trillion (+4.9%)
$515.4 billion - United States Department of Defense
$145.2 billion(2008*) - Global War on Terror
$70.4 billion - United States Department of Health and Human Services
$68.2 billion - United States Department of Transportation
$45.4 billion - United States Department of Education
$44.8 billion - United States Department of Veterans Affairs
$38.5 billion - United States Department of Housing and Urban Development
....
-------
After Social Security, the DoD is second, and by a relatively wide margin.
I disagree.
That's not true, unless you're specifically talking about income taxes.
A lot of those job providers already have tax exemptions and STILL outsource simply because labor is simply beyond cheap overseas, due to much cheaper standards of living. A change in tax code won't make the American worker suddenly accept to work for $10/hour.

Regardless, you continue to invest in people. Throw em a goddam bone. Things are tough all over, and they/we are the godammed future.
If it makes people feel better, maybe it's worth it...
...for the politicians.
Regardless, if we get another bite at the apple, we can do it better next time. Policy more focused on people isn't a bad angle at all.

It would if everyone would actually use that money to go spend on things that they would not have bought otherwise. The fundamental failure of the "give away money & hope" approach to stimulus is that people are afraid right now. A large percentage of the population would simply take their $300 a month and apply it towards things that produce no short term stimulative benefit whatsoever. Things like putting the money into savings. Paying down debt. Investing in retirement accounts (anyone with a brain should be able to figure out that if you get rid of SS taxes for 2 years there's going to be a price to be paid for that somewhere down the road). Or maybe they need the money to simply be able to sustain their current expenditures.
From a personal finance standpoint, each of those causes are far more intelligent use of extra money than spending it. From an economic standpoint, those causes are what makes that entire approach to stimulus ineffective. People are worried about their jobs. I don't see all that large a percentage of them saying to themselves "Gee, I might get laid off any day now, but I've got this extra $300 so I'm going to go buy an X-box."
If you believe that the government has a responsibility to try and create aggregate demand, the efficient way to go about it is to have the government be the en y demanding goods and services, not just some giant en y handing out free money in hopes that demand magically creates itself. Invest in infrastructure. , go down to the unemployment office and hire people to pick up trash and clean graffiti. Put people back to work by, gasp, hiring them to do some work.
Isn't that at ude how we ended up with this huge funding gap in the first place?
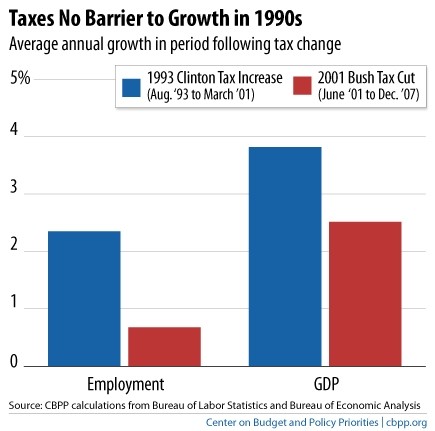
As a prefice, I don't have a problem going back to the Clinton-era tax rates for all tax brackets. But when looking at this chart one does need to keep in mind that Clinton caught the good part of the tech bubble and Bush caught the bad part. GDP and employment growth were going to be better in the 90s than the 00s no matter whose tax rates were in effect.
Last edited by coyotes_geek; 06-09-2011 at 09:47 AM.
In fairness, 2cents specified its appropriateness of this at ude for recessions. Not at all times.
What you listed is the presidents request, and the "mandatory spending" isn't broken down. I didn't try to make heads or tails of it, but the "request" is not necessarily what congress passes. The numbers I presented are the actual money spend per department up to FY 2010 and estimated for 2011+
I suggest you get excel and download some of those links. Don't believe me. See what the OMB is required by law to report.
I'll tell you what. I will make another plot with all lines. We will see how SS fits in.
I understand that the requested amount is not the actual appropriated amount for discretionary spending, but there has to be some correlation, not entire heads and tails. I actually have Excel here at work, and the table you used as source is missing some items (like Debt Interest Payments) and also lumps things such as Medicare-Medicaid into the Department of Health and Human services, which has both mandatory and discretionary spending.
Even then, the expenses for 2010 are still (this is from the table you linked and graphed):
$854 billion - Department of Health and Human Services (includes mandatory Medicare - Medicaid)
$754,1 billion Social Security
$666,7 billion - Department of Defense (including Overseas Contingency Operations)
$444,3 billion - Treasury (this is very likely still cost for the TARP)
$129,4 billion - Department of Agriculture
$108,2 billion - Department of Veterans Affairs
Which more or less matches with the budget requests posted previously.
I haven't started graphing the numbers yet, but you may want to look at this PDF:
Historical tables
Pages 47 to 55 (pdf pages 51-59) are led Table 3.1OUTLAYS BY SUPERFUNCTION AND FUNCTION: 19402016. 2010 numbers are:
20.1% National defense
69.0% Human resources
2.6% Physical resources
5.7% Net interest
5.0% Other functions
-2.7% Undistributed offsetting receipts
Other good pages too. I just started scanning it.
But you can't lump all of them together. IE: You can't make Social Security, Medicare and Medicaid suddenly disappear. You can tweak it's eligibility to make reductions, but that's about it. Also, making any changes require passing a law (AFAIK anyways).
On the other hand, Defense is strictly discretionary. You don't need to pass a law to make cuts there.
Well, here's the complete graph with SS.
I think the non federal interest is included in the treasury number and that the interest to the other US programs like owed to SS are included in the Undistributed Offsetting Receipts. This is just a guess, I didn't search if my guess is correct.
When you claim the military spending is the highest, that is only true when looking at discretionary spending. Want to cut the budget?
I forget which table on the PDF file I linked last post, but one of the tables shows that Obama's debt is double what it was 7 years ago, and as high as during WWII.
The point is that Social Spending is the highest outlay, and is not a cons utional addressed item.
I purposely left out SS the first time I did the graph because it is suppose to be a separate program from tax revenues.
Look at the PDF I linked. There are different tables broken down different ways.
There are currently 1 users browsing this thread. (0 members and 1 guests)
 Posting Permissions