Page 1 of 6 12345 ... LastLast
Results 1 to 25 of 141
  1. #1
    Veteran
    My Team
    San Antonio Spurs
    Join Date
    Mar 2009
    Post Count
    97,536
    Fox Wrong Again On The Global Temperature Record

    GUTFELD: Can I address something, Bob? You always bring up this streak, the last ten years was about one and a half degrees warmer than the climate of the 70's. So that means - and actually, they also say that it hasn't been this warm since 1910. So that means we're still not back up to the 1910 levels of heat.

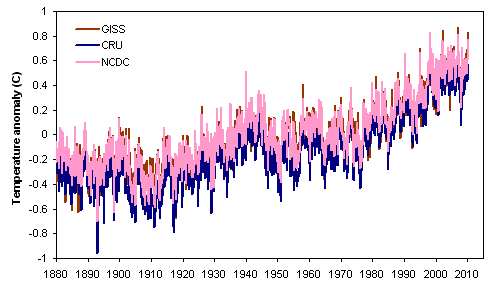
    We are far above the "1910 levels of heat" as can easily be seen from the global temperature record, which dates back to 1850. This chart shows how the global surface temperature each year differs from the 1961-1990 average:


    As this chart from the National Oceanographic and Atmospheric Administration makes clear, the last decade was the warmest on record:


    http://mediamatters.org/blog/2011081...County+Fair%29

    =========

    Obviously, Fox is where you right-wingers do your climate research.
    Last edited by boutons_deux; 08-10-2011 at 09:48 PM.

  2. #2
    I play pretty, no? TeyshaBlue's Avatar
    My Team
    Dallas Mavericks
    Join Date
    Jun 2006
    Post Count
    13,321

    Obviously, Fox is where you right-wingers do you climate research.
    Obviously, you need to gfy.

  3. #3
    Veteran
    My Team
    San Antonio Spurs
    Join Date
    Mar 2009
    Post Count
    97,536
    Another excellent contribution from TeyshaBlue.

  4. #4
    I play pretty, no? TeyshaBlue's Avatar
    My Team
    Dallas Mavericks
    Join Date
    Jun 2006
    Post Count
    13,321
    See post #2, bot.

  5. #5
    Veteran
    My Team
    San Antonio Spurs
    Join Date
    Mar 2009
    Post Count
    97,536
    TB's great hits just keep coming.

  6. #6
    Veteran DarrinS's Avatar
    My Team
    San Antonio Spurs
    Join Date
    Jun 2005
    Post Count
    42,561
    Look at the vertical scale of your first graph.


    Oooh, scary stuff.

  7. #7
    Veteran DarrinS's Avatar
    My Team
    San Antonio Spurs
    Join Date
    Jun 2005
    Post Count
    42,561
    Like a growing number of people not named Al Gore, color me unalarmed.

  8. #8
    Veteran Wild Cobra's Avatar
    My Team
    Portland Trailblazers
    Join Date
    May 2007
    Post Count
    43,117
    Boutons...

    Look up the difference between temperature and heat. When you understand the difference, we can talk.

  9. #9
    I play pretty, no? TeyshaBlue's Avatar
    My Team
    Dallas Mavericks
    Join Date
    Jun 2006
    Post Count
    13,321
    Attempting to project climatology trends from a chart with only 150 years of "data" is beyond asinine.

  10. #10
    Veteran Wild Cobra's Avatar
    My Team
    Portland Trailblazers
    Join Date
    May 2007
    Post Count
    43,117
    Attempting to project climatology trends from a chart with only 150 years of "data" is beyond asinine.
    On top of that, temperature does not measure latent heat.

  11. #11
    selbstverständlich Agloco's Avatar
    My Team
    San Antonio Spurs
    Join Date
    Jan 2007
    Post Count
    9,019
    TB's great hits just keep coming.
    What are the ordinante units B?

    Boutons...

    Look up the difference between temperature and heat. When you understand the difference, we can talk.
    On top of that, temperature does not measure latent heat.
    Not sure what you're getting at here. Are you saying that Boutons' articles don't account for latent heat? If so, you're shooting yourself in the foot WC......think about it.

  12. #12
    Veteran Wild Cobra's Avatar
    My Team
    Portland Trailblazers
    Join Date
    May 2007
    Post Count
    43,117
    What are the ordinante units B?


    Not sure what you're getting at here. Are you saying that Boutons' articles don't account for latent heat? If so, you're shooting yourself in the foot WC......think about it.
    Yes, temperature and heat are not equal when state changes are involved. Look at the surface area we have covered over where natural ground moisture cannot cool the surrounding air, because it's capped in concrete, asphalt, etc.

    Most temperature measuring sites are surrounded by changing terrain over the years. The albedo and emissivity has changed over the years with these changes.

    Heat increases and vaporizes moisture from the ground with less effect on temperature as more ground moisture is available. Only when moisture is no longer being absorbed does the immediate temperature rises linear with heat. Temperatures not only rise quicker in the morning when heat doesn't put as much moisture through state change, but the change in materials like concrete and asphalt increase the surrounding temperatures too. Both are excellent black body radiators compared to plants, and don't utilize incoming energy as stored chemical changes.

    Have you read any of the controversy over measuring global temperatures? Nearby all measuring sites have undergone nearby landscape changes over the years, and the remote ones are being removed. Probably for convenience. maybe because they don't provide the increasing results of the agenda.

  13. #13
    selbstverständlich Agloco's Avatar
    My Team
    San Antonio Spurs
    Join Date
    Jan 2007
    Post Count
    9,019
    Yes, temperature and heat are not equal when state changes are involved. Look at the surface area we have covered over where natural ground moisture cannot cool the surrounding air, because it's capped in concrete, asphalt, etc.

    Most temperature measuring sites are surrounded by changing terrain over the years. The albedo and emissivity has changed over the years with these changes.

    Heat increases and vaporizes moisture from the ground with less effect on temperature as more ground moisture is available. Only when moisture is no longer being absorbed does the immediate temperature rises linear with heat. Temperatures not only rise quicker in the morning when heat doesn't put as much moisture through state change, but the change in materials like concrete and asphalt increase the surrounding temperatures too. Both are excellent black body radiators compared to plants, and don't utilize incoming energy as stored chemical changes.

    Have you read any of the controversy over measuring global temperatures? Nearby all measuring sites have undergone nearby landscape changes over the years, and the remote ones are being removed. Probably for convenience. maybe because they don't provide the increasing results of the agenda.
    Ya ya.....state changes store thermal energy as potential (vibrational) vs kinetic (translational, rotational), etcetera, etcetera. I know that potential energy states don't influence temp.

    What I was getting at is that there's necessarily more thermal energy in the system if you account for those phase changes than if you don't. I don't know if his article actually did account for it or not. I was just asking.

    Honestly though I think the article simply "misspoke" heat vs temp. But you're correct in your assertions here, it has to be spelled out clearly.

    I can't say that I'm up to speed on temperature mesauring standards. I know the thermodynamics of the situation though (asphalt as a blackbody, etc.). What you say sounds valid. The location of measurement must be consistent in it's conditions as well.

  14. #14
    e^(i*pi) + 1 = 0 MannyIsGod's Avatar
    My Team
    San Antonio Spurs
    Join Date
    Mar 2003
    Post Count
    57,943
    Look at the vertical scale of your first graph.


    Oooh, scary stuff.
    At what point does warming get concerning and what are you basing it off of?

  15. #15
    e^(i*pi) + 1 = 0 MannyIsGod's Avatar
    My Team
    San Antonio Spurs
    Join Date
    Mar 2003
    Post Count
    57,943
    Attempting to project climatology trends from a chart with only 150 years of "data" is beyond asinine.
    Based on what? You can project climatology trends with FAR under that but it depends on the context. Using 150 years for climate trends with temperature is fine, TB.

  16. #16
    Veteran DarrinS's Avatar
    My Team
    San Antonio Spurs
    Join Date
    Jun 2005
    Post Count
    42,561
    At what point does warming get concerning and what are you basing it off of?
    When they go beyond noise level.

  17. #17
    Veteran
    My Team
    San Antonio Spurs
    Join Date
    May 2008
    Post Count
    20,699
    Attempting to project climatology trends from a chart with only 150 years of "data" is beyond asinine.
    But it looks much scarier that way.


  18. #18
    e^(i*pi) + 1 = 0 MannyIsGod's Avatar
    My Team
    San Antonio Spurs
    Join Date
    Mar 2003
    Post Count
    57,943
    When they go beyond noise level.
    Whats the noise level for global temperatures and what are you basing it off of?

  19. #19
    e^(i*pi) + 1 = 0 MannyIsGod's Avatar
    My Team
    San Antonio Spurs
    Join Date
    Mar 2003
    Post Count
    57,943
    But it looks much scarier that way.

    It helps when you use proper data to make your graphs. You can make the graph time line be a million years and it doesn't mean anything if you use bad data.

    If you want to argue that its not scary, then you're more than welcome to (AGW theory generally doesn't disagree that current warming is too big of a deal TBH - its future warming which is the issue) but at least use proper data. The anomaly is much higher than your graph shows.

  20. #20
    Veteran
    My Team
    San Antonio Spurs
    Join Date
    May 2008
    Post Count
    20,699
    but at least use proper data.
    You want the actual measured temperatures from 2000 years ago?

    The anomaly is much higher than your graph shows.
    What are you looking at? The measured anomaly is within the margin of error of the reconstructed temps illustrated in the graph.

  21. #21
    e^(i*pi) + 1 = 0 MannyIsGod's Avatar
    My Team
    San Antonio Spurs
    Join Date
    Mar 2003
    Post Count
    57,943
    Looking at the graph again does it stop circa 1950?

  22. #22
    e^(i*pi) + 1 = 0 MannyIsGod's Avatar
    My Team
    San Antonio Spurs
    Join Date
    Mar 2003
    Post Count
    57,943
    You want the actual measured temperatures from 2000 years ago?


    What are you looking at? The measured anomaly is within the margin of error of the reconstructed temps illustrated in the graph.
    Of course not - I want accurate temperature figures for more recent years.

    The mean for your graph there shows a whopping anamoly of 0.1 degrees Celsius. The mean accepted by the scientific community from the 3 main temperature records is 4 to 5 times higher.

    Now, if the graph doesn't come as far as 2000 - and it appears as it doesn't - then its more accurate. But then you have to wonder why they stopped it short.


  23. #23
    e^(i*pi) + 1 = 0 MannyIsGod's Avatar
    My Team
    San Antonio Spurs
    Join Date
    Mar 2003
    Post Count
    57,943
    In any event, the only point to showing current warming is to show that the sensitivity to C02 and not to show that current warming is "scary".

    I'll give you an imperfect analogy. If you stood 200 yards down from an accelerating vehicle and the speed at the 10 yard mark was only 5 mph you wouldn't say its only going 5mph so there's no need to worry because the point is that its accelerating and its going to be going much faster by the time it actually reaches you.

    Like I said, imperfect but I think it gets the point across.

  24. #24
    Veteran DarrinS's Avatar
    My Team
    San Antonio Spurs
    Join Date
    Jun 2005
    Post Count
    42,561
    In any event, the only point to showing current warming is to show that the sensitivity to C02 and not to show that current warming is "scary".
    What do you think of the period from 1940 to early 1970's?

    I'll give you an imperfect analogy. If you stood 200 yards down from an accelerating vehicle and the speed at the 10 yard mark was only 5 mph you wouldn't say its only going 5mph so there's no need to worry because the point is that its accelerating and its going to be going much faster by the time it actually reaches you.
    Yes. Quite imperfect.

    A better analogy might be a vehicle that is a mile away from you and has been alternating between moving toward you and moving away from you for the past 4½ billion years. But in the last century, it has moved a few feet closer to you.

  25. #25
    e^(i*pi) + 1 = 0 MannyIsGod's Avatar
    My Team
    San Antonio Spurs
    Join Date
    Mar 2003
    Post Count
    57,943
    We've discussed the period before Darrin. Several times. Either you have some of the weirdest Alzheimers I've ever seen or you selectively refuse to remember it.

Thread Information

Users Browsing this Thread

There are currently 1 users browsing this thread. (0 members and 1 guests)

Posting Permissions

  • You may not post new threads
  • You may not post replies
  • You may not post attachments
  • You may not edit your posts
  •