Page 1 of 4 1234 LastLast
Results 1 to 25 of 92
  1. #1
    Veteran Wild Cobra's Avatar
    My Team
    Portland Trailblazers
    Join Date
    May 2007
    Post Count
    43,117
    If you don't understand the below graphs, why do you pretend like you understand anything about Global Warming?


  2. #2
    Believe.
    My Team
    Chicago Bulls
    Join Date
    Nov 2008
    Post Count
    174
    Actually, your initial statement is unbelievably arrogant. Some people are better at absorbing information textually, some visually, etc... Some people also tend to comprehend information better when presented in layman's format.

    In other words, one need not be a scientist with a Ph.D in order to comprehend fully the nature of information, but that they may be more limited in the methodology that can be used to lead them to said full comprehension.

  3. #3
    Veteran Wild Cobra's Avatar
    My Team
    Portland Trailblazers
    Join Date
    May 2007
    Post Count
    43,117
    Actually, your initial statement is unbelievably arrogant. Some people are better at absorbing information textually, some visually, etc... Some people also tend to comprehend information better when presented in layman's format.

    In other words, one need not be a scientist with a Ph.D in order to comprehend fully the nature of information, but that they may be more limited in the methodology that can be used to lead them to said full comprehension.
    The point is that the information is very relavant, yet people tend to ignore what they don't understand. There can be no valid discussions about global warming without factoring in the sun's influence.

  4. #4
    Veteran Wild Cobra's Avatar
    My Team
    Portland Trailblazers
    Join Date
    May 2007
    Post Count
    43,117
    Here is another one:


    This is a historical recreation using the proxy isotopes and other materials collected for the Vostok Ice Cores. To the far left, is the time of the graph. I believe it's 2004 data. Regardless, it is within the last few years. The exact date doesn't matter. The blue is temperature and the green is CO2. Red is dust. My first thought was that the dust was long volcanic activity, but then I remembered that colder climate brings very little precipitation, thus, more dry land. I don't think that one matters for the discussion of Global Warming, and that is only an educated guess.

    This graph is found in the wki entry Ice Core. Under the paragraph "Ice core data," the following paragraph is found:

    Isotopic analysis of the ice in the core can be linked to temperature and global sea level variations. Analysis of the air contained in bubbles in the ice can reveal the palaeocomposition of the atmosphere, in particular CO2 variations. There are great problems relating the dating of the included bubbles to the dating of the ice, since the bubbles only slowly "close off" after the ice has been deposited. Nonetheless, recent work has tended to show that during deglaciations CO2 increases lags temperature increases by 600 +/- 400 years. Beryllium 10 concentrations are linked to cosmic ray intensity which can be a proxy for solar strength (see proxy).
    I would like to point out that it says CO2 lags temperature by 200 to 1000 years. The reason for this is that CO2 is stored in the oceans. the colder the water, the more the oceans can absorb. This doesn't happen immediately. Since the oceans layers take time to mix, it is a multiple century process to come into equilibrium.

    With that in mind, notice that the temperature rises rather rapidly at the left. The period is actually a few thousand years since the graph covers over 400,000 years. Anyway, where it stops the steep rise at around 11,000 to 13,000 years ago, so does the green (CO2.) Notice the CO2 stops at about 260 ppm at this point. Then, over the time from then till now, there is a regular fluctuation in temperature, ranging from about -2C to +2C. Even as mankind populated the earth in numbers, burned wood, etc. The temperature stays within a +/-2 Celceus range. If CO2 drove temperature, wouldn’t the increase to about 280 ppm drive the average above +2 on the graph?

    Again, in nature, Temperature drives CO2. CO2 does not drive temperature. We have been industrialized since about 1750. The start of our increased CO2 will not be fully absorbed until 1950 to 2750. With the way equilibrium equations work, CO2 is not a problem. The greater the difference in balance, the faster the intake. We simply don't have enough fossil fuel so do that. As part of the equation, I know acification is the latest red herring. However, the way the carbon cycle works, the carbonic acid is in equilibrium with other changes. Also, with the slow nature of change in nature, the increased acification cannot be attributed to CO2 increases in the past century. More likely, other factors that are in the understood chemical equations, and maybe things not understood.

    Now Beryllium 10 is mentioned. That is another proxy yet that supports how much solar radiation has increased on the earth. I may get to that later.

    Now I'll go back to my first two graphs in post#1. The first one is Carbon 14 vs. time. Since there is an approximate 60 year lag between the creation of Carbon 14 before is can be seen in paleoclimotology record, the data is not available for the last few decades. However, notice that from the time of about 1700 to near present, the Carbon 14 has raised quite a bit. By about 40 permilles. Now you need to understand how these changes occur. Carbon 14 in made in the upper atmosphere by solar radiation changing nitrogen into carbon. It does this by the formula 1n + 14N → 14C + 1H. This process increases with increased solar radiation and decreases with lower solar radiation. We see the normal 11 year sunspot cycles, but there are also long term changes of the sun. Observed proxy data of carbon 14 production tells us that the sun has increased quite a bit from about 1700 to present. Isn't the claim of the alarmists that CO2 is the reason for global warming? Their models are based on studies of CO2, temperature, and time. There models have no room for the observed changes of solar radiation. I say, and so do many reputable scientists, the sun is the cause of nearly all the observed temperature increases. There is no doubt when you look at the long term solar changes and apply simple math to the subject.

    Lets go to the second graph in post#1. This is a compilation of different direct measurements by satellites. Calibrations do not remain perfect, and it's impossible to know which satellite drifted in calibration by how much. That's why there are three different compilations. The article I took this from is here. Anyway, please not they all show the running average to be above the long term average ever since we have been taking direct satellite readings of the suns output. At least until about 2004. Two of the three composites show we went under the long term average of solar output. I wonder why the alarmists never mention the fact that most the data they use ends at 2004. I don’t remember seeing data since 2004 being used by the believers. I see newer articles, but not newer data.

    I will likely continue with more graphs and explanations. Maybe one day, I’ll get through to a few people with the truth about global warming.
    Last edited by Wild Cobra; 11-12-2008 at 09:27 PM.

  5. #5
    I don't really care... Yonivore's Avatar
    My Team
    San Antonio Spurs
    Join Date
    Oct 2001
    Post Count
    26,781
    Pish posh, what's the sun got to do with heat?

  6. #6
    Veteran
    My Team
    San Antonio Spurs
    Join Date
    May 2008
    Post Count
    20,699
    The reason for this is that CO2 is stored in the oceans.
    And now you have officially failed.

  7. #7
    Veteran Wild Cobra's Avatar
    My Team
    Portland Trailblazers
    Join Date
    May 2007
    Post Count
    43,117
    Pish posh, what's the sun got to do with heat?
    LOL...

    That seems to be what the alarmists believe. Maybe I should explain a bit simpler.

    For you alarmists.

    the sun is not a constant source of heat. The radiation from the sun changes by about 0.1% during the normal 11 year cycle. That doesn’t seem like much, but since the sun is the source of almost all the earths heat, a 0.1% change is a minimum of a 0.23 C change in temperature. Long term solar changes are not precisely determined, but at least large enough to account for a 0.45 C change since 1700, and likely more than 0.5 C increase.

    Think of it this way. If you turn the thermostat up in your living room, it gets warmer (unless you didn't pay your utility bill.) If you decrease the thermostat, it gets colder.

    The sun is the source of our heat. More radiation means warmer climate. Less radiation mean cooler climate.

    No disputing the facts of physics.

  8. #8
    Veteran Wild Cobra's Avatar
    My Team
    Portland Trailblazers
    Join Date
    May 2007
    Post Count
    43,117
    And now you have officially failed.
    The ocean contains about 50 times more CO2 than what is in the atmoshere. Please know what you are talking about before making such erroneous statements.


    Carbon dioxide is in soft drinks. Notice how the carbon dioxode stays linger in them when they stay cold, but if you open a warm one up, it may fizz like crazy? More gas dissolves in cold water than warm water.

    How about this:

    Stop Global Warming... Stpo Drinking Soft Drinks...

    If you believe CO2 is the problem, then please do your part.

  9. #9
    Alleged Michigander ChumpDumper's Avatar
    My Team
    San Antonio Spurs
    Join Date
    May 2003
    Post Count
    154,406
    Did we need another global warming thread?

  10. #10
    Veteran Wild Cobra's Avatar
    My Team
    Portland Trailblazers
    Join Date
    May 2007
    Post Count
    43,117
    Isn't it funny how RandomPropagandaGuy refuses to touch this aspect of the Global Warming debate?

  11. #11
    Veteran Wild Cobra's Avatar
    My Team
    Portland Trailblazers
    Join Date
    May 2007
    Post Count
    43,117
    Did we need another global warming thread?
    This thread focuses on the primary cause of global warming. Yes, another is needed. Each aspect should be separated because the subject is a very complex one. there should also be a separate on on greenhouse gasses. There are at least these two themes that should he considered alone, for what is known about them.

  12. #12
    Veteran Wild Cobra's Avatar
    My Team
    Portland Trailblazers
    Join Date
    May 2007
    Post Count
    43,117
    Hey Random...

    What do you have to say on the subject?

  13. #13
    Veteran Wild Cobra's Avatar
    My Team
    Portland Trailblazers
    Join Date
    May 2007
    Post Count
    43,117
    I have attempted to determine the cause of differences in accepted data vs. conclusions. I have yet to figure out where the mistakes are of leading scientists. Here is one topic I decided to look at. The GISS has for example, the following graph:


    Now this same graph is used in wiki. I haven’t yet reconciled the numbers they call Forcing in Watts per square meter. I believe this is a mistake, I’m not sure what it represents, but the levels of forcing are closer to net changes over the accepted 7.5 years lag rather than instantaneous forcing. Consider most numbers are arrived from modeling rather than a real understanding, this can easily be the case.

    Here is a more complete representation not in wiki. It shows the levels in actual radiated watts rather than forcing watts:


    I also took the tabular data they have available, and plugged it into Excel. Here is a graph I generated:


    Now please notice that I added a 7.5 year rolling average and an 11 year rolling average. The 7.5 year average represents the effective power changes because of climate lag rather than instantaneous. The 11 year average effectively removes the 11 year solar cycle, reducing it to a long term change. I probable should have changed the watts for this purpose from 1366 to 235 to represent the global view. You see, since only half the earth is exposed to the sun at any given time, some is refracted back to space, and most of the exposed surface is not perpendicular to the radiation, the Earth only sees about 17.2% of the solar radiation. Now the value change of the 7.5 average over 11 years during the last few decades is maybe 0.3 watts. I’ll use 1366 watts for my percentage figure of 0.022%. Apply that to the 235 watts in the below model. And we see a .05 watt change. However, because it becomes part of the greenhouse heat feedback of 452 watts, it increases to the 0.099 watt figure.

    You see, it makes sense that the chart marked instantaneous forcing is labeled wrong.

    I went to all this to point out something crucial. The long term data over the last century is what many like to point out. Now these solar calculations at the GISS only go back to 1850, and I can only show an 11 year smoothing starting with 1860. However, since that time, the power levels increased from 1364.7 to 1366.1 over the last 100 years on the chart. That alone is a .1% increase directly. That 0.1% now indicates a forcing change also of 0.1% of the 452 greenhouse feedback, or an easy 0.45 watts. Now since the 452 feedback indicates a 32 degree greenhouse effect, it is also a 0.32 C increase in temperature.

    Those 0.1% increase in solar radiation is universally accepted. What is disputed, is that many scientists using proxy data over the centuries and say it exceeds 0.2% since the 1600’s. I am among those who concur with the 0.2% increase. This amounts to a 0.64 C increase since then, accounting for most of the temperature change we see since the start of the industrial revolution. Here is one reason why:


    Notice how the solar activity shows the same reduced activity from 1860 to 1890 then increases and follows the same trend. Notice how there is almost no activity and the isotope levels are at the lowest graph points at 1700. Anyone involved with Helioseismography will tell you this is true.

    Simple accepted greenhouse effect model:
    Last edited by Wild Cobra; 04-16-2009 at 10:09 PM.

  14. #14
    I am that guy RandomGuy's Avatar
    My Team
    San Antonio Spurs
    Join Date
    Jun 2005
    Post Count
    51,121
    I don't think that one matters for the discussion of Global Warming, and that is only an educated guess.
    "educated guess?" What type of scientific mumbo jumbo is that? I tell you. No matter where you look at the anti-alarmists theories, they change the results biased of their opinion.

    “educated guess” is absolutely laughable. They don’t like what the facts provide, so they guess differently?

    OK. I understand.

  15. #15
    I am that guy RandomGuy's Avatar
    My Team
    San Antonio Spurs
    Join Date
    Jun 2005
    Post Count
    51,121
    Hey Random...

    What do you have to say on the subject?
    I liken this whole debate to three guys in a cave with a sleeping bear.

    One of the guys starts poking the bear with a stick. After a minute or so, he starts poking the bear a bit harder than previously.

    The other two then start arguing over how hard the guy is now poking the bear.

    One says "he is poking he bear 30% harder" and the other says "he is poking the bear 90% harder".

    The real issue is DON'T ING POKE SLEEPING BEARS WITH STICKS.

    Sure, the bear could wake up naturally and rip the guys' faces off over time, but why take the risk of poking the bear in the first place and increasing the chance?
    Last edited by RandomGuy; 11-18-2008 at 10:00 AM. Reason: minor grammar repair.

  16. #16
    I am that guy RandomGuy's Avatar
    My Team
    San Antonio Spurs
    Join Date
    Jun 2005
    Post Count
    51,121
    Don't think I'm not going to create a "number of guys poking bears with sticks" vs. "number of guys missing faces" graph and post it here...

  17. #17
    I am that guy RandomGuy's Avatar
    My Team
    San Antonio Spurs
    Join Date
    Jun 2005
    Post Count
    51,121
    I would like to point out that it says CO2 lags temperature by 200 to 1000 years. The reason for this is that CO2 is stored in the oceans. the colder the water, the more the oceans can absorb.
    So, if, by man-made actions, we release massive amounts of CO2 into the atmosphere, and that greenhouse gas warms the ocean slightly, it could lead to the ocean giving up CO2 and warming the atmosphere further, leading to still more releases of CO2?

    Sounds like a self-feeding cycle of accelerating warming to me.

  18. #18
    Displaced 101A's Avatar
    My Team
    San Antonio Spurs
    Join Date
    Apr 2005
    Post Count
    7,711
    I liken this whole debate to three guys in a cave with a sleeping bear.

    One of the guys starts poking the bear with a stick. After a minute or so, he starts poking the bear a bit harder than previously.

    The other two then start arguing over how hard the guy is now poking the bear.

    One says "he is poking he bear 30% harder" and the other says "he is poking the bear 90% harder".

    The real issue is DON'T ING POKE SLEEPING BEARS WITH STICKS.

    Sure, the bear could wake up naturally and rip the guys' faces off over time, but why take the risk of poking the bear in the first place and increasing the chance?
    Bad analogy.

    Better analogy.

    There's 20 people in a dark cave.

    There's a dude with a stick doing something.

    ONE very excited guy starts screaming and flailing about that the guy with the stick is poking a bear. He says that the other guys must pay him to keep the guy with the stick from waking the bear up.

    A couple of the other guys start screaming along with the first one; 5 of the guys start paying the original, and 9 couldn't care less, and go about living in the cave.

    The single remaining guy ACTUALLY looks at what the guy with the stick is doing, and realizes that there is no BEAR AT ALL!!!

    He gets beaten to death.

  19. #19
    I am that guy RandomGuy's Avatar
    My Team
    San Antonio Spurs
    Join Date
    Jun 2005
    Post Count
    51,121
    Bad analogy.

    Better analogy.

    There's 20 people in a dark cave.

    There's a dude with a stick doing something.

    ONE very excited guy starts screaming and flailing about that the guy with the stick is poking a bear. He says that the other guys must pay him to keep the guy with the stick from waking the bear up.

    A couple of the other guys start screaming along with the first one; 5 of the guys start paying the original, and 9 couldn't care less, and go about living in the cave.

    The single remaining guy ACTUALLY looks at what the guy with the stick is doing, and realizes that there is no BEAR AT ALL!!!

    He gets beaten to death.
    I know this was an attempt at humor, but the bear represents the potential for rapid, catastrophic climate change.

    This potential exists whether man does anything or not.

    For your analogy to be valid, you would have to be able to make the case that rapid, catastrophic climate change doesn't exist.

  20. #20
    Live by what you Speak. DarkReign's Avatar
    My Team
    Detroit Pistons
    Join Date
    Jun 2005
    Post Count
    10,571
    This Thread is Going Places.

    I forsee an epic display of bad analogies (ive made more than a few) and their spawn in the near future.

    Wait, wait....my turn...

  21. #21
    Veteran Wild Cobra's Avatar
    My Team
    Portland Trailblazers
    Join Date
    May 2007
    Post Count
    43,117
    I don't think that one matters for the discussion of Global Warming, and that is only an educated guess.
    Here I was specifically talking about the dust. There are dramatic level changes. They are at near zero for the time periods we are debating over. Do you want a real discussion, or are you goint to remain RandomPropagandaGuy?
    "educated guess?" What type of scientific mumbo jumbo is that? I tell you. No matter where you look at the anti-alarmists theories, they change the results biased of their opinion.

    “educated guess” is absolutely laughable. They don’t like what the facts provide, so they guess differently?
    OK. I understand.
    That's right, change my words. Make you feel smart? At least I am demanding reasonable evidence and you take a scientists 'suggestion' as fact.

    Rather than finding someone’s work, do like I do. Find someone’s work, and show you understand it and can argue with it. Better yet, show you can argue over the points I bring up that you always seen to ignore.

    Again, years ago, it was scientific consensus that the world was flat. The few who said otherwise were ridiculed and even dealt with harshly by religious fundamentalists as heretics. I don't mind being a modern heretic. History will prove your scientists of consensus fools. The Nobel prize will become a serious joke. The likes of you, will hopefully live to see your mistakes of wanting so much money devoted to protecting sailor from sailing off the edge of the earth.

  22. #22
    Veteran Wild Cobra's Avatar
    My Team
    Portland Trailblazers
    Join Date
    May 2007
    Post Count
    43,117
    IFor your analogy to be valid, you would have to be able to make the case that rapid, catastrophic climate change doesn't exist.
    How can anyone do that when we all agree that nature does catastrophic things. My point is that CO2 is not a bad thing. I have yet to see any verifiable evidence it is. In fact, the plants love it. Part of increased crop yields are due to CO2 increases.

    Why to the alarmists want to starve the plant life on Earth?

    Equal Rights for Plants Now!

  23. #23
    Veteran Wild Cobra's Avatar
    My Team
    Portland Trailblazers
    Join Date
    May 2007
    Post Count
    43,117
    So, if, by man-made actions, we release massive amounts of CO2 into the atmosphere, and that greenhouse gas warms the ocean slightly, it could lead to the ocean giving up CO2 and warming the atmosphere further, leading to still more releases of CO2?

    Sounds like a self-feeding cycle of accelerating warming to me.
    My God man. How many times must I explain such a concept? There is a 32 C to 33 C greenhouse effect as agreed on by science. A large part of the debate is how much is caused by CO2. Simply looking at the blackbody radiation of the earth vs. the spectra that CO2 captures tells us only a small amount of warming is cause by CO2 that isn’t already trapped by water vapor. Can you remember those graphs, or must I supply those too?

    Here is a simple model I made that shows the relationship of CO2 and warming as maximum levels I can find justified. It allows for just over a 0.3 C rise in temperature by CO2 from the levels of 280 ppm to 380 ppm, but I forget for sure. I may have used the 278 to 387 level changes. The Excel file is on one of two different computers. Now that I have a large USB drive, I need to consolidate all my work. Anyway, the graph:


    Please notice I projected what a times two change in CO2 does from preindustrialization. It only adds another ¼ C approximate. Remember, I made this as a worse case graph. 6 C for the starting 280 ppm. With a 32 C starting point for say 1750, that amounts to 18.75% of the warming due to CO2. Much more than I believe the CO2 effect is, but like I said, I go for worse case here. Now you can debate if I placed the values in the right spots relative to the curve shape if you like, but other evidence shows my graph to be at least close to accurate. Look at this next one:


    Please notice the warming increase of about 8 C correlates with a change of CO2 from about 180 ppm to 264 ppm. The temperature then fluctuates by about +/- 2 C starting about 10,000 years ago. The CO2 however increased ranged from about 255 ppm to the 284 ppm with no change on the temperature. They have no correlation. The +/- 2 C is referred to as Bond Events.

    I have asked you this before:

    If CO2 has such an effect on temperature, what hasn’t the increased CO2 from 10,000 years ago to 9,000 years ago driven the temperatures accordingly? Surely by the above graph, they should be at least 4 C warmer if the graph stayed consistent as CO2 driving temperature. Explain please.

    I agree with the CO2 lagging temperature:

    Ice Core Records of Atmospheric CO2 Around the Last Three Glacial Terminations:

    Ice Core Records of Atmospheric CO2 Around the Last Three Glacial Terminations
    Hubertus Fischer, Martin Wahlen, Jesse Smith, Derek Mastroianni, Bruce Deck

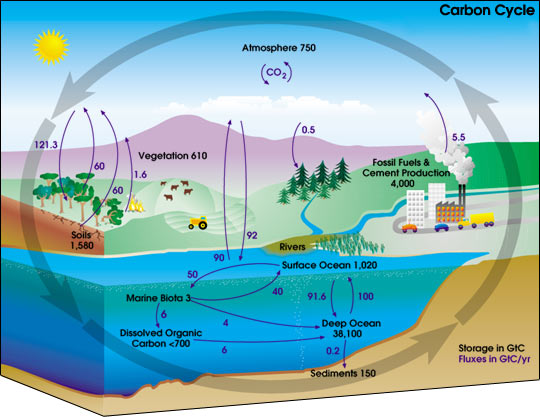
    Air trapped in bubbles in polar ice cores cons utes an archive for the reconstruction of the global carbon cycle and the relation between greenhouse gases and climate in the past. 
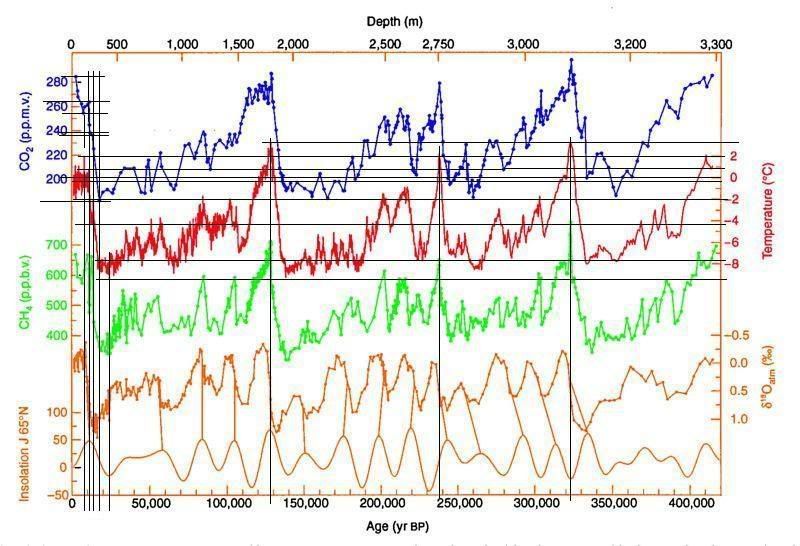
High-resolution records from Antarctic ice cores show that carbon dioxide concentrations increased by 80 to 100 parts per million by volume 600 ± 400 years after the warming of the last three deglaciations. Despite strongly decreasing temperatures, high carbon dioxide concentrations can be sustained for thousands of years during glaciations; the size of this phase lag is probably connected to the duration of the preceding warm period, which controls the change in land ice coverage and the buildup of the terrestrial biosphere.
    Other material I have read in the past uses a number of 28 ppm increase atmospheric in CO2 for a 1 C change in ocean temperature. That is just the slope value for current temperatures and it isn’t linear. If we applied that to the oceans long term value changes we calculate a 224 ppm change for 8 C change. That would mean we achieve equilibrium at 404 ppm if it was linear.
    Last edited by Wild Cobra; 04-16-2009 at 10:07 PM.

  24. #24
    Displaced 101A's Avatar
    My Team
    San Antonio Spurs
    Join Date
    Apr 2005
    Post Count
    7,711
    I know this was an attempt at humor, but the bear represents the potential for rapid, catastrophic climate change.

    This potential exists whether man does anything or not.

    For your analogy to be valid, you would have to be able to make the case that rapid, catastrophic climate change doesn't exist.

    Bears exist; the people in the cave KNOW it, and know that an awake, provoked bear in the cave means sudden, catastrophic death.

    It makes the threat "real", and credible (in fact, there are ancient, fossilized bones of dinosaurs who got destroyed by a prehistoric bear).

    However, at the time, there is actually NO bear in the cave.

  25. #25
    Displaced 101A's Avatar
    My Team
    San Antonio Spurs
    Join Date
    Apr 2005
    Post Count
    7,711
    This Thread is Going Places.

    I forsee an epic display of bad analogies (ive made more than a few) and their spawn in the near future.

    Wait, wait....my turn...
    C'mon, let's have it.

    Bears, a cave, people and a ing stick! Build an analogy!

Thread Information

Users Browsing this Thread

There are currently 1 users browsing this thread. (0 members and 1 guests)

Posting Permissions

  • You may not post new threads
  • You may not post replies
  • You may not post attachments
  • You may not edit your posts
  •