Page 3 of 6 FirstFirst 123456 LastLast
Results 51 to 75 of 141
  1. #51
    e^(i*pi) + 1 = 0 MannyIsGod's Avatar
    My Team
    San Antonio Spurs
    Join Date
    Mar 2003
    Post Count
    57,943
    So now he's not responding because he agrees with you.

    You're endless entertainment.

  2. #52
    Veteran Wild Cobra's Avatar
    My Team
    Portland Trailblazers
    Join Date
    May 2007
    Post Count
    43,117
    So now he's not responding because he agrees with you.

    You're endless entertainment.
    There you go spinning again.

    Maybe you should look the definition of "if" up.

  3. #53
    selbstverständlich Agloco's Avatar
    My Team
    San Antonio Spurs
    Join Date
    Jan 2007
    Post Count
    9,019
    Yes, I know. Maybe he isn't comfortable using his scientific knowledge in this topic. Can't blame him, especially if he agrees with me and then has to contend with the likes of you.

    All these things you poke fun at have explanation. Again, review our previous discussions instead of acting like a 6 year old.
    So now he's not responding because he agrees with you.

    You're endless entertainment.
    To be clear, I'm not responding because I don't have a lot of time right now. If WC's observations and calculations have merit, I won't hesitate to say so.

    I'll respond when I get a good block of time.

  4. #54
    Veteran Wild Cobra's Avatar
    My Team
    Portland Trailblazers
    Join Date
    May 2007
    Post Count
    43,117
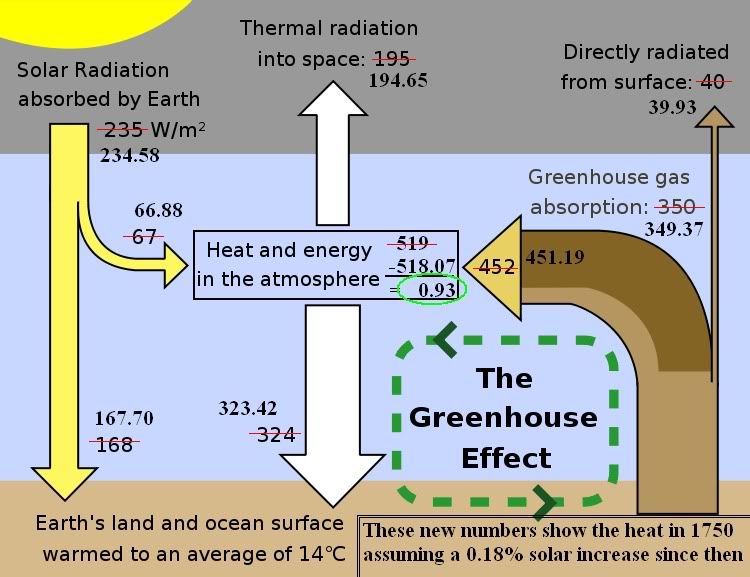
    When you look at it, keep in mind, the solar energy varies in the area of 1366 watts/square meter in space. By the time you account for the day/night cycle and disk area to coverage of the half sphere at a time, the energy is 1/4, or about 342 watts/square meter. Then you have the albedo of the earth leaving the number about 235 watt which is used here. If you disagree with anything, find another greenhouse effect model you like and number you agree with, and see how much of a radiative forcing change you get at a given change in solar radiation.

  5. #55
    Veteran cantthinkofanything's Avatar
    My Team
    San Antonio Spurs
    Join Date
    Mar 2010
    Post Count
    14,938
    Trade Parker while he still has some value.

  6. #56
    The Wemby Assembly z0sa's Avatar
    My Team
    San Antonio Spurs
    Join Date
    Jun 2005
    Post Count
    15,772
    Obviously, you need to gfy.

  7. #57
    selbstverständlich Agloco's Avatar
    My Team
    San Antonio Spurs
    Join Date
    Jan 2007
    Post Count
    9,019
    Agloco, I'd like your opinion on something. You seem to be one of the few people in this sports forum that understands science.

    Some time back, I made a simple addition to an early NASA/GISS drawing that illustrates the Greenhouse Effect in a simplistic way. I took the average 0.18% increase in solar radiation from the Maunder Minima to our recent timeframe using the data from the Lean 2004 study. Other studies have larger changes, others less. I picked this particular study because the data is available to the public, and is about midway between others. My 0.18% calculated came from putting the data in Excel, and using a 11 year rolling average. I went from there and changed added what the radiative power would have been and added them to the graph.

    I'm going to use the term watts. When I do, know I am simplifying and what I am indicating is watts per square meter.

    The IPCC AR4 report uses 0.12 watts for solar radiative forcing changes since 1750. They actually call it direct forcing in one place, but don't dwell much on it. My 0.18% does show a change of 0.12 watts of direct forcing. However, the total change in solar heat is more. There is also an increase of 0.3 watts that makes it to the ground, as the driving heat for the greenhouse effect. When done, I calculate a total increase of radiative forcing of 0.93 watts. Not just 0.12 watts.

    Two or three points since the AR4, the IPCC has admitted radiative forcing increases are greater than previously thought. Their revised number is in the neighborhood 0f 0.4 watts, from 0.1 watts. These combined are 1.11 greater that the values assessed in the AR4. The way temperature vs. radiative forcing is understood, this means they have to reduce some other factor. They give CO2 an increased forcing of 1.66 watts. This fits what I understand of CO2 forcing, reducing it to about 0.55 watts.


    I think I left the excel file on a different computer, I can find the Lean 2004 data again and do the work again if necessary. This is from a different study, but my graph with the 0.18% increase looks very similar:

    You'd need to look at a Keeling curve or some other accepted CO2 tracking method to confirm your su ions. You can check if the forcing figures are accurate by doing two CO2 forcing calculations:

    One with your figures, one with theirs using CO2 concentration as the only "greenhouse variable". It's a log relationship, so the connection may not be immediately obvious. Choose your reference concentration wisely

    Mind you, there are other en ies that aren't transparent to radiation also. Have you confirmed that any of those haven't been adjusted as part of the greenhouse figures? I dont know what the convention is so I am asking if this is a usual assumption.

    Basically this will boil down to: Do you buy the solar forcing change graphs, or the CO2 concentration graphs. You'll necessarily need to trust one or the other to do this.

    Another thing: Is that "climate sensitivity" factor a constant? From my admittedly hasty read, I gather it isn't necessarily so....


    If you agree or not with my entire rational of the above, do you at least agree the forcing for solar changes are greater than stated by the IPCC?
    I await your calculations.

  8. #58
    e^(i*pi) + 1 = 0 MannyIsGod's Avatar
    My Team
    San Antonio Spurs
    Join Date
    Mar 2003
    Post Count
    57,943
    No, CO2's forcing isn't a constant. There are diminishing returns as eventually you get saturation. The first doubling will have more of an effect than the second doubling, etc.

    Other factors - such as aerosols - are certainly taken into account when considering the entire system.

    As for awaiting WC's calculations, I do too! I asked him for them earlier and I was told I was adding nothing to the conversation. Hopefully as the request comes from you we'll see them.

  9. #59
    selbstverständlich Agloco's Avatar
    My Team
    San Antonio Spurs
    Join Date
    Jan 2007
    Post Count
    9,019
    No, CO2's forcing isn't a constant. There are diminishing returns as eventually you get saturation. The first doubling will have more of an effect than the second doubling, etc.

    Other factors - such as aerosols - are certainly taken into account when considering the entire system.

    As for awaiting WC's calculations, I do too! I asked him for them earlier and I was told I was adding nothing to the conversation. Hopefully as the request comes from you we'll see them.
    Yeah.....there's a climate factor there though if you want to convert to temps. That's the one I was wondering about. It's called a "climate sensitivity factor" denoted by lambda in the equations.

  10. #60
    e^(i*pi) + 1 = 0 MannyIsGod's Avatar
    My Team
    San Antonio Spurs
    Join Date
    Mar 2003
    Post Count
    57,943
    Sorry! I misread


    Dt = lambda * Df (I have no idea how to make the lambda symbol)

    Dt = change in temp and Df is the direct forcing from the sun.

    Lambda incorporates more than simply CO2 but since many of those are variable at certain levels it certainly is not a constant.

  11. #61
    I am that guy RandomGuy's Avatar
    My Team
    San Antonio Spurs
    Join Date
    Jun 2005
    Post Count
    51,121
    But it looks much scarier that way.


    URL for graph = loehle_fig3.JPG
    Dr Loehle isn't actually a climatologist, or even anything closely related, he is in fact a computer consultant and programmer. To be fair, he does have a degree in ecology.
    http://answers.yahoo.com/question/in...2174440AAyM0RC

    Zippity-do-dahing to the source data:


    http://www.econ.ohio-state.edu/jhm/AGW/Loehle/
    and
    http://www.econ.ohio-state.edu/jhm/A...C_E&E_2008.pdf


    With the corrected dating, the number of series for which data is available
    drops from 11 to 8 in 1935, so that subsequent values of the reconstruction would be
    based on less than half the total number of series, and hence would have greatly
    decreased accuracy. Accordingly, the corrected estimates only run from 16 AD to 1935
    AD, rather than to 1980 as in Loehle (2007)
    So basically the happy fun graph doesn't incorporate any data from the last 80 years.?

    ... and this is supposed to be convincing?

  12. #62
    selbstverständlich Agloco's Avatar
    My Team
    San Antonio Spurs
    Join Date
    Jan 2007
    Post Count
    9,019
    Sorry! I misread


    Dt = lambda * Df (I have no idea how to make the lambda symbol)

    Dt = change in temp and Df is the direct forcing from the sun.

    Lambda incorporates more than simply CO2 but since many of those are variable at certain levels it certainly is not a constant.
    Yeah I gathered that, but I read that section quite quickly so I wasn't sure. If it's not that's yet another confounding varable.

  13. #63
    I am that guy RandomGuy's Avatar
    My Team
    San Antonio Spurs
    Join Date
    Jun 2005
    Post Count
    51,121
    Sorry! I misread


    Dt = lambda * Df (I have no idea how to make the lambda symbol)

    Dt = change in temp and Df is the direct forcing from the sun.

    Lambda incorporates more than simply CO2 but since many of those are variable at certain levels it certainly is not a constant.
    Λ

    λ

    Not sure if you wanted upper or lower case.

  14. #64
    selbstverständlich Agloco's Avatar
    My Team
    San Antonio Spurs
    Join Date
    Jan 2007
    Post Count
    9,019
    Λ

    λ

    Not sure if you wanted upper or lower case.
    Lower

  15. #65
    e^(i*pi) + 1 = 0 MannyIsGod's Avatar
    My Team
    San Antonio Spurs
    Join Date
    Mar 2003
    Post Count
    57,943
    You can do estimates from CO2 and solar energy as you suggested, though. Many of the other variables - such as volcanic gasses in the stratosphere (whats up Pinitubo) are short lived and rare. You obviously won't get exact figures but using a range of sensitivities given for CO2 and solar output you can get some good estimates of the climate sensitivity of both factors.

    If the scientific community was somehow pulling these numbers out of their collective ass it wouldn't be hard at all too show considering the data we have which is available to all.

  16. #66
    I am that guy RandomGuy's Avatar
    My Team
    San Antonio Spurs
    Join Date
    Jun 2005
    Post Count
    51,121
    No, CO2's forcing isn't a constant. There are diminishing returns as eventually you get saturation. The first doubling will have more of an effect than the second doubling, etc.

    Other factors - such as aerosols - are certainly taken into account when considering the entire system.

    As for awaiting WC's calculations, I do too! I asked him for them earlier and I was told I was adding nothing to the conversation. Hopefully as the request comes from you we'll see them.
    I seem to remember reading that the ultimate top-off point was something like 1300 ppm CO2


    That means there is a good way to go.

    It was about 290 in 1900 or so, I think.

  17. #67
    I am that guy RandomGuy's Avatar
    My Team
    San Antonio Spurs
    Join Date
    Jun 2005
    Post Count
    51,121

    Also if you feel like wading through the 48+ pages:

    http://spurstalk.com/forums/showthread.php?t=163637

    At some point actual science is addressed. Darrin even posted some moderately scientific points/studies to his credit.

    Some of it is kinda funny.

    I went so far as to actually contact the author of one of the other scientific papers that WC and I were discussing, and get some feedback. That was cool.

  18. #68
    Veteran Wild Cobra's Avatar
    My Team
    Portland Trailblazers
    Join Date
    May 2007
    Post Count
    43,117
    You'd need to look at a Keeling curve or some other accepted CO2 tracking method to confirm your su ions. You can check if the forcing figures are accurate by doing two CO2 forcing calculations:
    For what I have laid out, I am not attempting to quantify CO2. I am only showing that solar forcing is more than just the direct solar forcing. I do not accept the levels the prominent experts claim CO2 adds in radiative forcing. Not only are the high numbers used, but there is a wide range of numbers out there. A range of 9% to 26% of the greenhouse effect by CO2 is a pretty big range. Most certainly shows lack of certainty. The IPCC and other alarmists use the high percentage. I think it's only about 10% to 12%. , it may be even lower than the 9%. The 26% is simply insane.

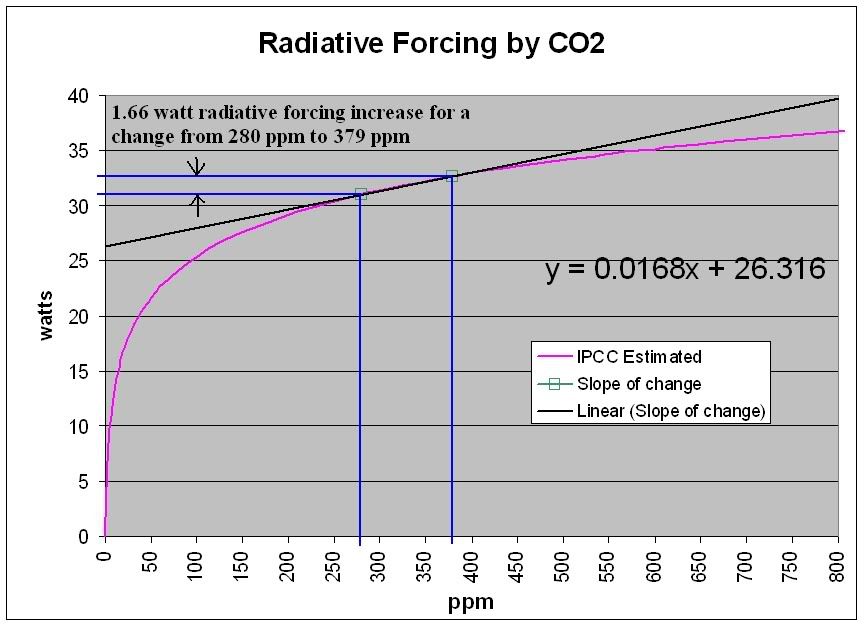
    Now if I go by what the IPCC says, I get this from excel:


    I reconstructed that using two reference points supplied by the IPCC AR4, and it shows about a 33 watt/square meter radiative forcing of CO2 total at the 2004 timeframe.

    Again, an increase in solar radiation increases the direct and indirect heat. It's not just the 0.12 watts of direct solar heat, but with the added IR emanating from the surface.

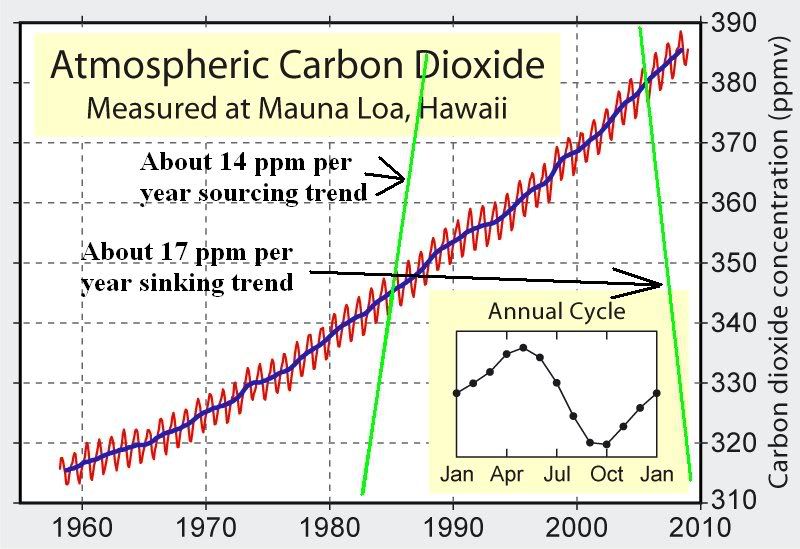
    I have looked at the Keeling curve before. Here is one image I added to in the past:


    If you notice, two trends, one up and one down, that show Co2 changes with warming and cooling. If CO2 drove temperature, then why does CO2 change with the summer/winter temperature changes?
    One with your figures, one with theirs using CO2 concentration as the only "greenhouse variable". It's a log relationship, so the connection may not be immediately obvious. Choose your reference concentration wisely
    Huh? I never included CO2, but see my above graph.
    Mind you, there are other en ies that aren't transparent to radiation also. Have you confirmed that any of those haven't been adjusted as part of the greenhouse figures? I dont know what the convention is so I am asking if this is a usual assumption.
    I am fully aware of this. Please understand, I have done a great deal of reading on the topic. Different gasses in the atmosphere have different sets of frequencies they respond to.

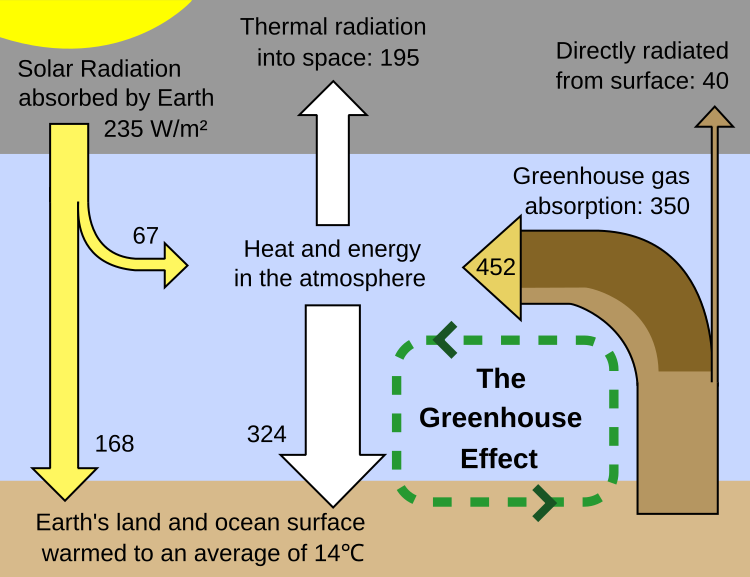
    I am using an accepted greenhouse gas model. I did not make this one up. I added numbers to show the effect of a solar change. The greenhouse effect number is total effect of all atmospheric gasses. The Here is the original:


    It is created from the data in an article led Earth’s Annual Global Mean Energy Budget. This article has another representation of the greenhouse effect, figure 7.

    Please also notice that in the Abstract of the article gives a CO2 value of 32 watts/square meter.
    Basically this will boil down to: Do you buy the solar forcing change graphs, or the CO2 concentration graphs. You'll necessarily need to trust one or the other to do this.
    Trust one or the other? That would be because one or the other is wrong, and how do you really determine which? I have decided that because both solar and black carbon forcing are far greater than stated by the alarmists, that the forcing CO2 is said to have is incorrectly high. For my conclusion to be incorrect, then even the lowest accepted solar increases since then maunder Minima would have to be wrong.

    I know this much as a certainty. The sun provides the earth with more than 99.99% of our heat. The heat collected by the earth surface is radiated back in mostly infrared radiation. The upward when lag is considered is equal to the downward energy. That said, the sun is the source for the energy that produces the greenhouse effect. As this source energy increases, the greenhouse energy returned with the greenhouse effect with no greenhouse gas level change will increase, as the greenhouse effect is a feedback of the original solar energy.

    Bottom line is that the change atmospheric radiative force is proportional to the incoming solar changes. With no solar energy (heat source), there would be no greenhouse effect.
    Another thing: Is that "climate sensitivity" factor a constant? From my admittedly hasty read, I gather it isn't necessarily so....
    All these variables keep changing. Climate sensitivity of course will also change with the atmospheric changes. Again, temperature and heat are two different things. Watts is a measurement of energy directly proportional to heat.
    I await your calculations.
    For what? A simple 0.18% increase in solar power will equate to a 0.18% increase in atmospheric radiative forcing? All atmospheric forcing is a feedback of the incoming solar power, therefore, it will be at least nearly proportional to the incoming heat. I'm speaking long term, not short term also.

    I wonder if I miss judged you. Let me ask in a simpler way. Do you agree that atmospheric heat will be proportional to solar heat with all other factors equal, or not?
    Last edited by Wild Cobra; 08-16-2011 at 07:16 PM.

  19. #69
    I am that guy RandomGuy's Avatar
    My Team
    San Antonio Spurs
    Join Date
    Jun 2005
    Post Count
    51,121
    aw crap, here come the graphs...


    j/k

  20. #70
    selbstverständlich Agloco's Avatar
    My Team
    San Antonio Spurs
    Join Date
    Jan 2007
    Post Count
    9,019
    Also if you feel like wading through the 48+ pages:

    http://spurstalk.com/forums/showthread.php?t=163637

    At some point actual science is addressed. Darrin even posted some moderately scientific points/studies to his credit.

    Some of it is kinda funny.

    I went so far as to actually contact the author of one of the other scientific papers that WC and I were discussing, and get some feedback. That was cool.


    I'll take a look later this evening.

  21. #71
    🏆🏆🏆🏆🏆 ElNono's Avatar
    My Team
    San Antonio Spurs
    Join Date
    Apr 2007
    Post Count
    153,473

  22. #72
    e^(i*pi) + 1 = 0 MannyIsGod's Avatar
    My Team
    San Antonio Spurs
    Join Date
    Mar 2003
    Post Count
    57,943


    I'll take a look later this evening.
    Save yourself some trouble - its mostly garbage.

  23. #73
    e^(i*pi) + 1 = 0 MannyIsGod's Avatar
    My Team
    San Antonio Spurs
    Join Date
    Mar 2003
    Post Count
    57,943
    Oh boy - it seems WC misjudged Agloco.

  24. #74
    Veteran DarrinS's Avatar
    My Team
    San Antonio Spurs
    Join Date
    Jun 2005
    Post Count
    42,561
    Yeah.....there's a climate factor there though if you want to convert to temps. That's the one I was wondering about. It's called a "climate sensitivity factor" denoted by lambda in the equations.
    Interesting paper

    http://www.drroyspencer.com/Lindzen-...i-GRL-2009.pdf

  25. #75
    e^(i*pi) + 1 = 0 MannyIsGod's Avatar
    My Team
    San Antonio Spurs
    Join Date
    Mar 2003
    Post Count
    57,943
    What makes it interesting, Darrin?

Thread Information

Users Browsing this Thread

There are currently 1 users browsing this thread. (0 members and 1 guests)

Posting Permissions

  • You may not post new threads
  • You may not post replies
  • You may not post attachments
  • You may not edit your posts
  •